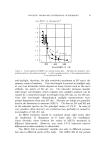
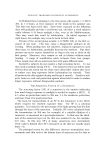
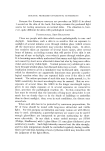
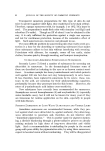
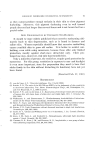
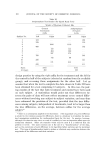
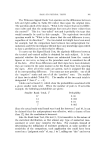
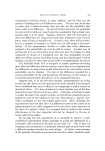
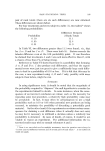
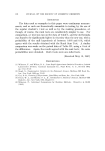
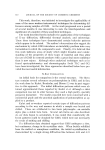
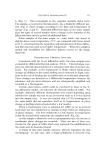
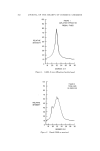
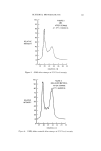
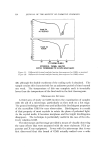
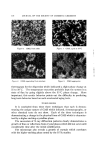
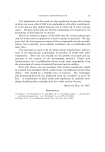
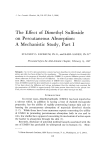
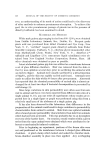
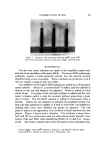
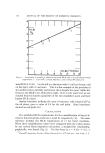
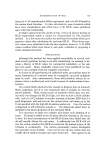
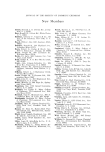
GLYCERYL MONOSTEARATE 115 range, usually in two distinct steps, and with the final melt of the last crystals as high as 72 øC. This was unexpected because the specifica- tions called for a melt at 57 ø by a sealed-tube method. The fact that the reported melting point for pure GMS is 81.5 øC suggests that this high-melting component may be a purer material. It should also be noted that the literature designates the beta poly- morph as the highest melting. Additional observations with the microscope of both GMS alone and in combination with other fatty components support the possibility that the phase changes noted in the X-ray diffraction patterns and the DTA data are manifestations of a slow crystallization of a purer GMS or the beta form. Illustrations of this phase change or growth of crystallinity are pro- vided in the following photomicrographs. Figure 6 shows a freshly pre- pared slide of GMS as it appears at 200 X magnification under polarized light. The slide was prepared by melting the sample under a cover glass and allowing it to cool. This approximates the alpha form of the litera- ture. The same slide maintained at 35 øC for two weeks changes its crystal structure (Fig. 7). Figure 8 shows a similar phase change in a blend of GMS with similar materials other than stearate esters. In this last case it was clearly established that the phase change, which ap- pears as a growth of rosettes, was due to the GMS and none of the other constituents. The conclusions of this work in regard to a specific problem, i.e., the stability of a particular formulation, were quite clear in their indica- tion of the cause of product breakdown. The quality of the dispersion would change in time due to the growth of microcrystalline aggregates which were shown to be essentially this higher melting from of GMS. These are shown in a photomicrograph of a thin layer of the formulation on a microscope slide (Fig. 9). This photomicrograph was taken at 200 X magnification with bright field illumination. It was also demonstrated by these various techniques how higher temperatures of storage could accelerate product breakdown by in- fluencing this crystal growth in GMS. An interesting anomaly should be noted, however, wherein a series of samples were subjected to an ac- celerated aging study by cycling the temperature from +4 ø to 120 øF, once every 24 hours. The test formulation appeared to be quite stable under these conditions for several weeks. This is quite contrary to the demonstrated instability at 35 øC (95 øF) already described. The para- dox is probably explained, at least in part, by inspection of the DTA

116 JOURNAL OF THE SOCIETY OF COSMETIC CHEMISTS Figure 6. GMS, fresh slide Figure. 7 GMS, aged at 35øC ' ' • .•'•,'•' • ¾•4'•*d..: '- :: •. 2 .•'. Figure 8. GM8 separating from mixture Figure 9. GMS aggregates thermogram for the dispersion which indicated a slight phase change at 35 to 38 øC. The temperature excursion probably kept the system in a state of flux by going slightly above the 35 øC phase change. More important, this erratic behavior points out the difficulty in predicting long-term behavior based on such accelerated aging tests. CONCLUSIONS It is concluded from these three techniques that each is demon- strating the unique nature of GMS which infrared, chromatography, or other chemical tests do not show. Each of the three techniques is demonstrating a change in the physical form of GMS which is character- ized by a higher-melting crystalline phase. The succession of X-ray diffraction patterns dearly demonstrates a growth of lines or reflections from crystal planes which did not exist until considerable time after the initial solidification. The microscope also reveals a growth of crystals which correlates with the higher-melting phase noted by the DTA studies.
Purchased for the exclusive use of nofirst nolast (unknown)
From: SCC Media Library & Resource Center (library.scconline.org)