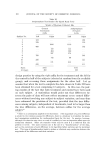
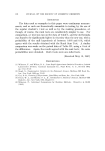
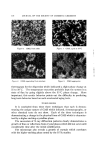
EASY STATISTICAL TESTS 105 pair of rank totals (there are six such differences) are now obtained. These differences are shown below. For four treatments and seven subjects a table (1), two-tailed,* shows the following probabilities: Difference Between Probability 2 Rank Totals 0.10 11.1 0.05 12.4 0.01 15.0 In Table VI, two differences greater than 11.1 were found viz., that for .4 rs. D and for C rs. D. These were both 16. Sixteen exceeds the tabular difference even at the 0.01 probability point. It can therefore be claimed that treatments A and C are each more effective than D, with a chance of less than 1 •o of being wrong. Reference to Table VI shows that there is a possibility that formulas A rs. B and B rs. C also produce real differences, and that the experi- mental errors were just too great to give a sufficiently large rank differ- ence to lead to a probability of 0.10 or less. If it is felt that this may be the case, a new experiment using A, B and C only, possibly with more subjects than before, might be run. SUMMARY In using significance tests, it should be noted that the magnitude of the probability required to "disprove" the null hypothesis is a matter for the experimenter himself to decide. In some instances, when the conse- quences of an incorrect conclusion are minor, such as the necessity for repeating some test procedure, a relatively high probability value may be acceptable. In fact, it may often be advantageous to use a high probability such as 0.10 or 0.05 when potential new products are being screened, to minimize the possibility of discarding a potentially good material. On the other hand, if the experimenter envisions serious conse- quences for claiming a real difference when it actually does not exist, he may feel it necessary to withhold a decision unless a relatively low probability is obtained. In cases of doubt, of course, it would be ad- visable to repeat an experiment. For additional information the in- terested reader may wish to consult references 4 and 5. * There is no one-tailed test for multiple treatments, since the question must always be "is there any real difference between any of several pairs of rank totals." A one-tailed test would not apply.

106 JOURNAL OF THE SOCIETY OF COSMETIC CHEMISTS ADDENDUM The data used as examples in this paper were continuous measure- ments, and as such are theoretically amenable to testing by the use of the regular student's t test as well as by the ranking procedures, al- though, of course, the rank tests are considerably simpler to use. For comparison, a t test was run on the data of Table I, and the old formula was found to be significantly higher in viscosity than the new one, with a probability of the null hypothesis of between 0.005 and 0.01, which agrees with the results obtained with the Rank Sum Test. A similar comparison was made on the paired data of Table III, using a t test of the differences. Again, the results agreed with the rank tests the same probabilities were obtained. Both t tests were one-tailed tests. (Received May 18, 1967) REFERENCES (1) Wileoxon, F., aud Wilcox, R. A., Some Rapid Approximate Statistical Procedures, Lederle Laboratories Division, American Cyanamid Co., Pearl River, N.Y., Revised 1964, pp. 7-12, 20-27. (2) Siegel, S., Nonparametric Statistics for the Behaz•ioral Sciences, McGraw-Hill Book Co., Inc., New York, 1956, pp. 75-8.3. (3) Cox, D. R., Planning of Experiments, John Wiley and Sons, Inc., New York, 1958. (4) Dixon, W. J., and Massey, F. J., Jr., Introduction to Statistical Analysis, McGraw-Hill Book Co., Inc., New York, 1951, Chapter 17. (5) Wilcoxon, F., Individual Comparisons by Ranking Methods. Biometrics 1, 80-83 (1945).
Purchased for the exclusive use of nofirst nolast (unknown)
From: SCC Media Library & Resource Center (library.scconline.org)