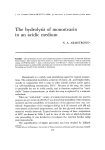
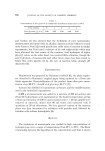
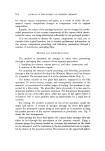
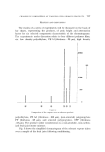
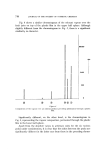
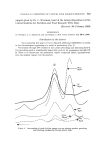
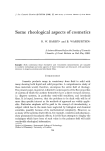
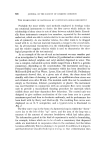
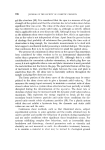
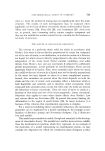
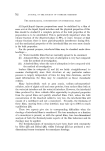
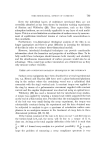
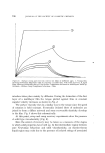
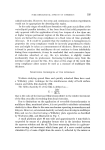
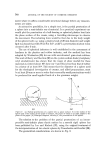
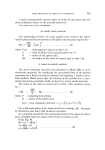
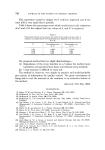
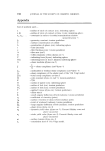
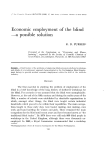
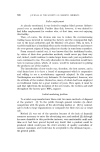
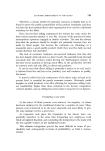
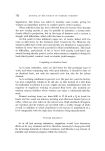
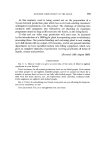
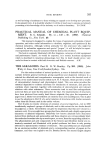
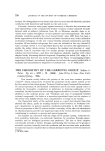
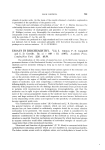
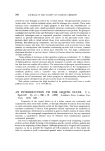
718 JOURNAL OF THE SOCIETY OF COSMETIC CHEMISTS Fig. 4 shows a similar chromatogram of the odorant vapour over the fruit juice on top of the plastic film in the upper half sphere. Although slightly different from the chromatogram in Fig. 3, there is a significant similarity in character. 56 300 lOO 3 400 [ 300 Figure 4 Composition of the vapour over an odorous product preceding permeation through a plastic film. Significantly different, on the other hand, is the chromatogram in Fig. 5, representing the vapour composition, permeated through the plastic film to the lower half sphere. Apart from the absolute values in arbitrary units for the six various peaks under consideration, it is clear that the ratios between the peaks are significantly different in the latter case from those in the preceding chrom-

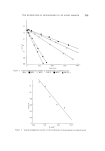
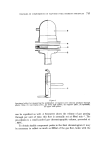
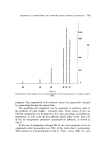
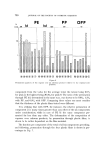
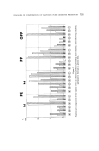
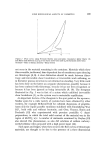
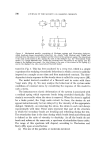
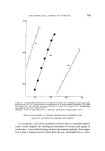
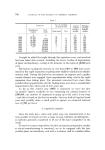
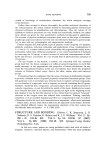
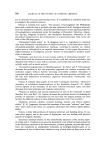
CHANGES IN COMPOSITION OF VAPOURS OVER ODOROUS PRODUCTS 719 5400 lOO I ,I o Figure 8 Composition of the vapour over an odorous product following permeation through a plastic film. atograms. The composition of the odorant vapour has apparently changed by permeating through the plastic film. The quantities per component can be expressed in arbitrary units of the products of peak height x retention time. These values of the six selected components can be related in the cases preceding, and following, permeation, as well as for all four different plastic films tested. Each one of the six components permeates quantitatively different, as shown in Fig. 6. In the case of permeation through PE ld, the total quantities of all six components after permeation was 7.t33/o of the total prior to permeation. This is shown by a horizontal line in Fig. 8. These values differ for each
Purchased for the exclusive use of nofirst nolast (unknown)
From: SCC Media Library & Resource Center (library.scconline.org)