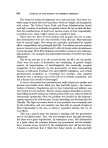
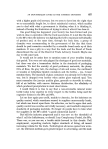
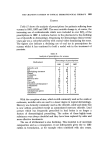
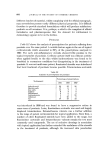
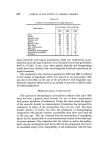
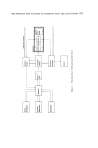
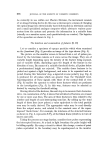
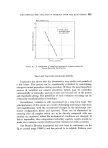
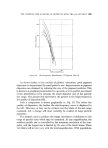
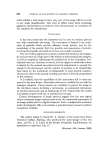
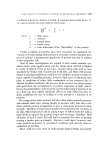
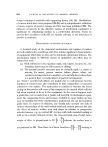
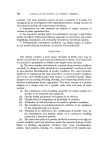
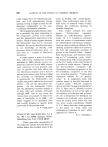
TItE PARTICLE SIZE ANALYSIS OF PIGMENTS WITH THE Q U•'INTIMET t387 lO0O lO0 lO 10 100 PARTICLE DIAMETER, Figure 18. Size-frequency distribution CI Pigment blue 15. As shown earlier, in the context of plastics coloration, good pigment dispersion is characterised by small particle size. Improvements in pigment dispersion are obtained by reducing the size of the pigment particles. This is shown in a graphical presentation by a general, or even partial, movement of the distribution curve towards the small diameter end of the particle size range. The greater this movement, the greater is the improvement in the quality of dispersion {13). Such a comparison is shown graphically in Fig. 18. The better the quality of dispersion, the further the size-frequency curve is displaced to the left. This may, or may not be evident over the whole of the size range examined, but a change will most certainly be evident at large particle diameters. The method used to produce the image introduces a limitation to the range of particle sizes which may be examined. At any magnification, the smallest particle size is controlled by the minimum resolution of the com- puter, and the largest size is limited by the size of the blank frame. These two limits will in turn vary with the total magnification. With populations

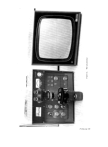
688 JOURNAL OF THE SOCIETY OF COSMETIC CHEMISTS which exhibit a wide range of sizes, only part of this range will be covered at any single magnification. This state of affairs arises when examining pigments, and introduces an element of the unknown into an evaluation of the complete size distribution. CONCLUSION It has been found that the Quantimet can be used to evaluate particle size with considerable advantage. The instrument is limited to the evalu- ation of particles which provide sufficient visual density, and by the morphology of the sample. Both free powders and suspensions of powders in transparent liquids and solids have been successfully examined. The use of this equipment has shown considerable practical advantages its use has removed a large part of the tedium of microscopical size analysis, as well as completely eliminating the subjectivity of size evaluation. Con- siderable time can, therefore, be saved, but the degree to which this is done is limited by the manual procedures involved (adjustment to present the sample to the microscope) and the number of particles to be counted (the time taken by the instrument is independent of total particle numbers whereas the time of the manual counting procedure is directly proportional to this number). It is unlikely that the capabilities of this instrument will be much im- proved in the near future. Alternative software is available for use with the analogue computer. Various means are available to present the image to the television camera including a microscope, an automated microscope, an electron microscope and an epidiascope (7, 17). Output from the system is available as meter read-out, or punched card or tape. Current developments of image analysis suggest that the next logical step in automatic image analysis must await the commercial appearance of an image system tied to a digital computer. Such a configuration is already under development (18), and promises a potential improvement in pattern recognition facilities. ACKNOWLEDGEMENTS The author wishes to thank Mr. A. Hooker of the South East Essex Technical College, Barking, who produced the micro-image of the test chart, and Dr. J. D. Lewis of the Rocket Propulsion Establishment, for permission to reproduce Fig. 11. (Received: 15th January 1969)
Purchased for the exclusive use of nofirst nolast (unknown)
From: SCC Media Library & Resource Center (library.scconline.org)