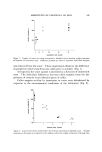
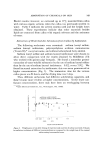
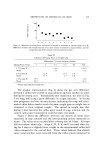
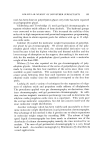
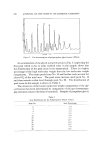
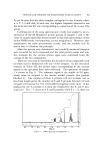
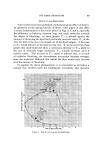
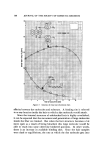
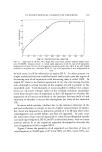
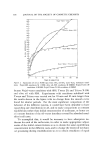
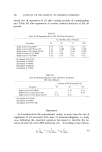
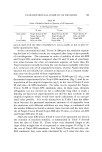
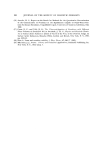
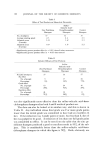
162 JOURNAL OF THE SOCIETY OF COSMETIC CHEMISTS t I I t i I 6.0 5.0 4.0 3.0 2.0 1.0 0 PPM ( • ) Figure 6. NMR spectrum of sample N,o. 3 8.0 7.0 7 E and F protons. Thus, as stated, this information complements the mass spectroscopic data. Alternatively, the relative integrals for all the protons can be de- termined and the integral at 2.0 ppm set equal to 3 protons. In this way, the number of protons in each integral and the total proton count for the molecule can be obtained. This is illustrated in Fig. 6, which shows the spectrum of sample No. 3. The numbers to the left of the integration trace are the relative integrals. If these numbers are multi- plied by 3 and the number of protons is summed, one gets 15 -[- 6 q- 3 q- 19: 43 protons which corresponds exactly to the proton count of the molecule where n = 4. CONCLUSION A commercial mixture of two different types of polymers has been separated. In the case of the polypropylene glycol, it was determined that the distribution was nonsymmetrical and, through the use of ap- propriate standards, three successive members of the gas chromatogram were identified. The aminopolyether acetate, on the other hand, did have a symmetrical molecular weight distribution, and after isolating three successive fractions, proof of their structures and the fact that they were indeed consecutive members of a series was accomplished by a combination of mass spectroscopy and nuclear magnetic resonance. The usefulness of this method for determining molecular weight distributions should be stressed. A gas chromatograph-mass spec-

MOLECULAR WEIGHT OF POLYETHER SURFACTANTS 163 trometer interface is the simplest most direct way to separate and analyze a complex mixture, although gas chromatography-mass spectroscopy interface instruments are still beyond the budgetary capability of most laboratories. However, most laboratories own or have easy access to a nuclear magnetic resonance spectrometer and have some facilities for chromatographic separation on a preparative scale. These may include preparative gas chromatography, thin-layer, or column chromatography. If one separates and collects fractions of a mixture, the fractions can be derivatized such as by acetylation on the terminal hydroxyl group. One now has a handle, which is easily located in the NMR spectrum and whose signal strength remains constant over all components of the mix- ture. One can then easily compare its signal to the signals which in- crease with increasing chain length. For polyether surfactants of molecular weight up to about 1200, this is a simple way of determining the chain length of any fraction. This information combined with the chromatographic separation data should give a complete molecular weight distribution. ACKNOWLEDGMENT The authors would like to thank Messrs. T. Karalis and K. Longley of Witco Chemical Co. for supplying the tertiary amine and Dr. M. Schulman of Varian Aerograph Co. for carrying out and interpreting the mass spectra. (Received October 5, 1971) REFERENCES (1) Gildenberg, L., and Trowbridge, J. R., Gas-liquid chromatographic separation of ethyl- ene oxide adducts of fatty alcohols via their acetate esters, J. Amer. Oil Chem. Soc., 42, 69-71 (1965). (2) Calzolari, C., Stancher, B., and Favretto, L., Molecular weight fractionation of poly- ethylene glycol by gas chromatography, J. Chromatogr., !18, 7-17 (1968). (3) Withers, M. K., The gas chromatography of polyethers, J. Gas Chromatogr., 6, 242-4 (1968). (4) Ludwig, F. J., St., Analysis of ethylene oxide and propylene oxide adducts of alkylphenols or alcohols by nuclear magnetic resonance, gas-liquid chromatography, and thin-layer chromatography procedures, Anal. Chem., 40• 1620-7 (1968). (5) Determann, H., Gel Chromatography, Springer-Verlag, New York, N.Y., 1968.
Purchased for the exclusive use of nofirst nolast (unknown)
From: SCC Media Library & Resource Center (library.scconline.org)