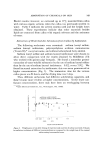
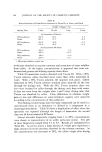
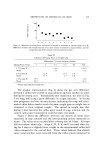
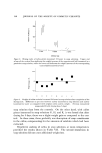
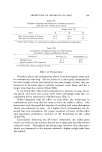
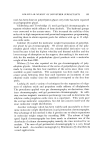
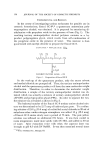
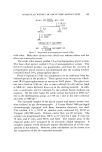
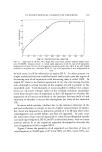
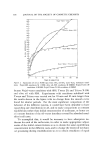
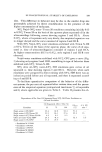
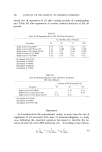
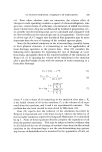
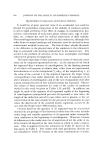
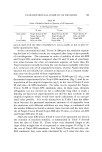
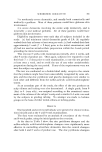
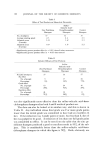
160 JOURNAL OF THE SOCIETY OF COSMETIC CHEMISTS Table II Area Distribution for the Aminopolyether Acetate Peak No. Area Percentage 1 5 7 9 11 13 15 17 19 21 23 24 09 07 28 64 10 3 12 5 13 5 12.8 10.5 7.7 5.3 2.8 tra were obtained on a Varian T60 NMR spectrometer on CdCla solu- tions with tetramethyl silane as internal standard. The mass spectra of the three isolated fractions were determined on a gas chromatograph-mass spectrometer interface with a computer print- out. If such an instrument is available, it is not necessary to isolate sam- ples. The highest fragment is obtained at rn/e 274 for sample No. 1 at m,/e 332 for sample No. 2 and at m/e 390 for sample No. 3. The differ- ence in mass between the three fractions is 58, which is equal to the mass of the propylene oxide repeating unit. This and the fact that the de- composition patterns are similar and vary in a regular manner indicate that the samples are three successive members of a homologous series. Table III shows the structural formula for the aminopolyether acetate. Table III Structural Formula of the Aminopolyether Acetate (APA) (D) (D) CHa CH• O CHa--CH•\ I I N--CH•--CH--O--(CH•--CH--O--)• C--CHa CHa--CH• (G) (F) (E) (F) (A) (C) (B) n Mol Wt No. of Protons 0 173 19 1 231 25 2 289 31 3 347 37 4 405 43 5 463 49

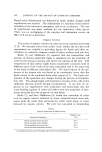
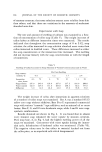
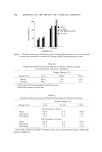
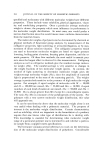
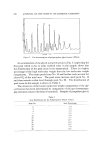
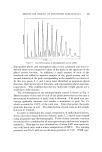
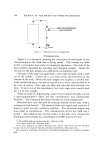
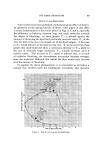
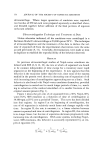
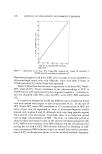
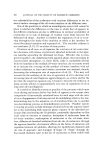
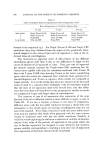
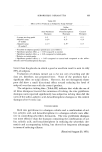
MOLECULAR WEIGHT OF POLYETHER SUKFACTANTS 161 It can be seen that the three samples correspond to the formula where n • 2, $, 4 and that, in each case, the highest fragment observed is not the molecular ion but one corresponding to a mass loss of 15, or one CHa group. Confirmation of the mass spectroscopic results was sought by an ex- amination of the 60 Megahertz proton spectra of samples 1 and $. Be- cause of sample impurities demonstrated in the mass spectroscopic analy- sis the NMR results, by themselves, are not unequivocal. However, they complement the mass spectroscopic results, and the analysis will be shown here to illustrate the principle. After the spectra were determined, two carefully measured integrals were recorded for each compound and the total proton counts and rela- tive integrals for the various proton types were calculated from the average of the two integrations. There are two ways to determine the structure of the compound, each of which will be illustrated with one of the samples. In the structural formula in Table III, the proton types corresponding to the various signals in the spectrum have been indicated. The spectrum of sample 1 is shown in Fig. 5. The reference signal is the singlet at 2.0 ppm, which must be assigned to the acetate methyl protons (the protons labelled A). The number of these A protons will not increase, but as the chain length grows the number of E and F protons between $.2 and 3.8 ppm will increase by 3 for every added propylene oxide unit. If the integral for the A protons is $, then the integral for the E and F pro- tons is 6.$. If n z l, there are 4 E and F protons, while if n z 2, there are 8.0 7.0 6.0 õ.0 4.0 3.0 2.0 1.0 0 PPM f'igure 5. NMR spectrum of sample No. 1
Purchased for the exclusive use of nofirst nolast (unknown)
From: SCC Media Library & Resource Center (library.scconline.org)