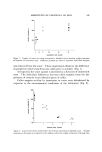
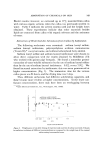
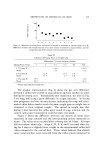
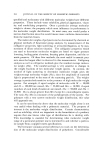
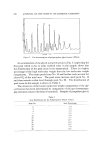
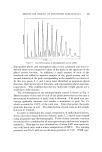
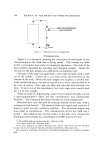
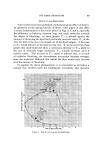
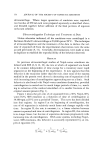
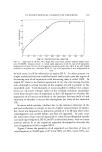
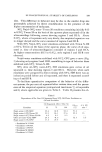
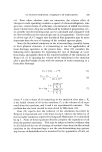
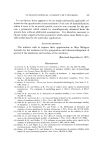
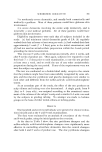
178 JOURNAL OF THE SOCIETY OF COSMETIC CHEMISTS •2 x ¸ 0 •:0 40 60 80 I00 120 TIME OF ULTRACENTRIFUGATION, MINUTES Figure 4. Separation of oil from 50% Nujol-50% water-0.15% Tween 20 emulsion (A 091069) plotted according to empirical eq 1 Emulsions prepared with 0.2% CPC were so stable as to be amenable to ultracentrifugal study only with difficulty, since even after 2 hours at 39,460 rpm only 8% of the Nujol had separated. Figure 4 illustrates that the rate of separation of oil from 50% Nujol- 50% water-0.15% Tween emulsions in the ultracentrifuge at 25øC at 39,460 rpm is well represented by the empirical equation. A similar re- suit was obtained with 50% olive oil-50% water-0.2% SDS emulsions (ll). It is useful to summarize briefly the different types of behavior found with each system with respect to rate of separation of oil. In the case of 50% Nujol-50% water-$D$ emulsions at all concentrations of 8D8, the curve of per cent oil separated vs. time of ultracentrifugation usually showed only regions I and II, although with very long periods regions III-A and IV were also found. Generally, there is no induction period even at high concentrations of 8D8. However, an induction period of about 12 rain was found in some of the present emulsions prepared with 0.4% 8D8 by direct mixing of the $D$ solution and the oil instead of by mixing the oil with a 0.2% $D$ solution followed by blending in suffi- cient concentrated 8D8 solution to give an overall final initial concentra- tion of 0.4% in the aqueous phase, as in the standard method of prepara-

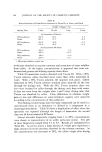
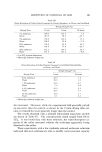
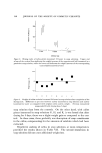
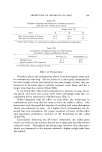
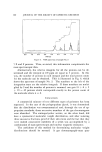
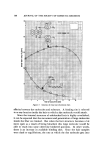
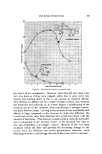
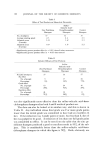
ULTRACENTRIFUGAL STABILITY OF EMULSIONS 179 tion. This difference in behavior may be due to the smaller drop size presumably achieved by direct emulsification in the presence of the higher concentration of surfactant. 50% Nujol-50% water-Tween 20 emulsions containing initially 0.15 to 0.35% Tween 20 on the basis of the aqueous phase separated oil in the ultracentrifuge following curves showing regions I and III-A. Above 0.35%, where oil separates only very slowly, the empirical equation was no longer obeyed and the curve consisted of regions I and III-B. With 50% Nujol-50% water emulsions stabilized with Triton X-100 at 0.1% Triton on the basis of the aqueous phase, the curve of oil sepa- rated rs. time of ultracentrifugation consisted of regions I and III-A. At higher concentrations (0.15 to 0.4%), only regions I and III-B were observed. Nujol-water emulsions stabilized with 0.1% CPC gave a curve (Fig. 3) showing only regions I and III-B, resembling in type of behavior those stabilized with 0.2% Triton X-100. 50% olive oil-50% water-0.2% SDS emulsions gave curves of oil separated vs. time showing regions ! and III-A. However, when such emulsions were prepared by direct mixing with 0.4% SDS there was an induction period before any oil separated, and then it separated accord- ing to I and III-B. To facilitate quantitative comparison of the behavior of the differ- ent systems, the per cent oil separated after various times and the param- eters of the empirical equation (extrapolated maximum % oil separable and b) where applicable are given in Table I. Table II presents the ob- Table I Dependence of Per Cent Oil Separated from 50% Oil-Water Emulsions on Oil and Emulsifier Oil Separated After t Min (%) Oil .... Emulsion 25 75 100 (%) b X 10 • min -! Nujol-water-0.2 % SDS" Nujol-water-0.2% Tween 20 b Nujol-water-0.2% Triton X-100c Olive oil-water-0.2% SDS a Nujol-water-0.1% CPC e 23.6 42.8 52.4 91.6 21.9 26.1 27.6 29.5 4.2 8.1 9.5 ... 29.3 41.6 ... 52.1 17.5 27.4 31.5 ... Emulsions M 111968. Emulsions A 091069. Emulsions A 090969ß Emulsions M 060669. Emulsions A 112669.
Purchased for the exclusive use of nofirst nolast (unknown)
From: SCC Media Library & Resource Center (library.scconline.org)