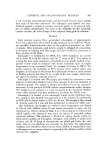
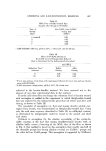
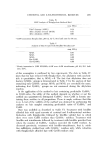
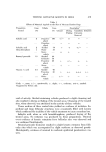
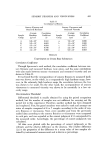
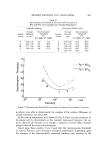
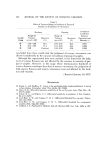
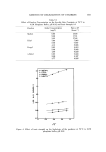
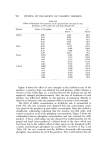
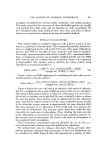
SENSORY FIRMNESS AND VISCOUSNESS 485 Smnple Group Table II Correlation Coehqcients Sensory Firmness and Sensory Viscousness and Measured Hardness Measured Viscosity Average Correlation Average Correlation Hardness Coehqcient Sample Viscosity Coehqcient (g/cm •ø) (r) Group (cps) (r) A 8.8 x 10 • 0.812 a 7.9 x 10 • 0.660 B 8.5 x 10'-' 0.893 b 1.5 x 10 • 0.860 C 2.5 x 10 •ø 0.934 c 5.5 x 10-0 0.873 D 9.5 x 10 • 0.748 d 2.2 x 10 '0 0.831 E 3.4 x 10 • 0.580 e 9.0 x 10 • 0.905 ]•ESULTS Experiments on Cream Base Substances Correlation Coefficient Through Spearman's rank method, the correlation coefficient betxveen sen- sory firmness and measured hardness xvere given, and the same calculations xvere also made betxveen sensory viscousness and measured viscosity and are shoxvn in Table II. It xvas found that the correspondence of sensory firmness to measured hard- ness xvas shoxvn, on the whole, in a comparatively high hardness range hoxv- ever, in the extremely high hardness range the correlation betxveen the txvo xvas shoxvn to be small. On the other hand, the correspondence of sensory viscousness to measured viscosity xvas shoxvn to be essentially in a low vis- cosity range. Discrimination Threshold Differential threshold is usually obtained by using the paired comparison method, but the number of samples was not sufficient for carrying out the paired test in this experiment. Therefore, another method has been designed and employed. First, the panel members xvere asked to rank and arrange one series of samples composed of 6 or 7 samples according to the order of sen- sory firmness or viscousness. Next, every possible pair from the previously ranked data according to the sensory firmness or viscousness xvere compared in each pair, and xvas regarded as the correct judgment if it corresponded to the measured order. Accordingly, the percentage of correct judgments was calculated. All data were plotted xvith the percentage of correct judgments as the ordinate and the relative difference as the abscissa. The relative difference (A) is the proportion of the difference to a mean value of txvo samples ob- tained by instrumental measurement and is shoxvn as percentage.

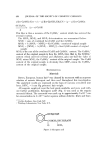
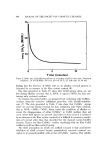
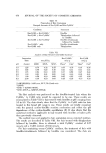
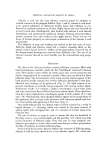
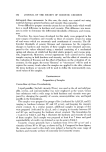
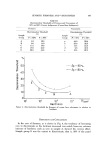
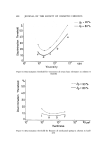
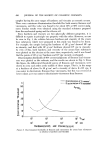
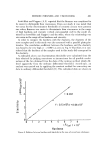
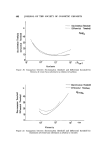
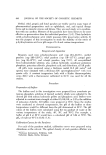
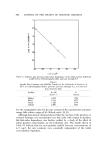
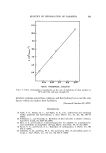
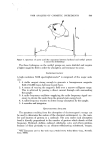
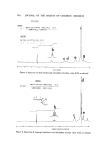
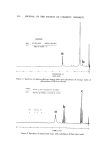
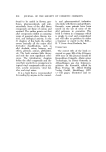
486 JOURNAL OF THE SOCIETY OF COSMETIC CHEMISTS c•100 •.= • 60 c• 40 •_ 20 o o ........ Y = 38.0 + 4.18 X- 0.104X • + 0.001 X • i x,•/ i i • • Relative Difference (zl-ta-b•'+-b 2 x lOO) Figure 3. Examples of approximation curves obtained by least squares method (sample c) a-b A-- a+b x100 2 The approximation curve was calculated from these points, using the least squares method, and is shown in Fig. 3. The value of the relative difference where 80 or 90% of the panels were able to give a correct judgment (p = 80, or p = 90) was obtained from this curve. In this paper, this value is referred to as the (relative) discrimination threshold of sensory firmness and viscous- ness, and it indicates that the diffcrence of hardness or viscosity in the two samples is judged correctly by 80 or 90% of the panel members. The discrimination thresholds of 80 and 90% correct judgments are shown in Table III. This is shown graphically in Figs. 4 and 5. Experiments on Standard Substances The discrimination thresholds for firmness of the standard elastic substance and viscousness of the standard viscous substance were studied. The discrimination thresholds of S0 and 90% correct judgments for firmness and viscousness were obtained for the mechanical spring and silicone oil in the same manner as previously described for the cream base substances. These results are shown in Table IV and Figs. 6 and 7.
Purchased for the exclusive use of nofirst nolast (unknown)
From: SCC Media Library & Resource Center (library.scconline.org)