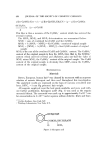
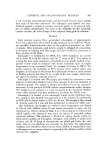
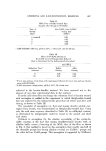
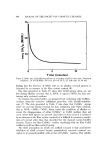
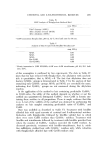
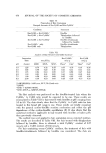
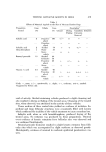
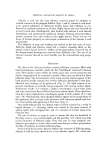
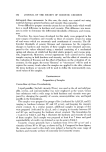
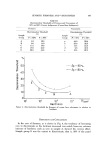
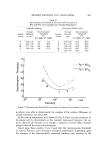
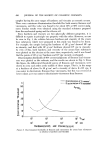
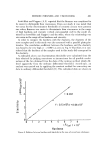
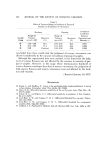
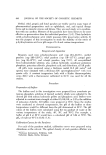
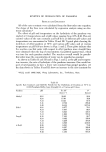
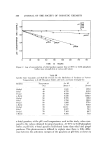
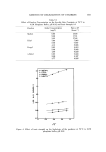
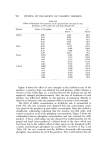
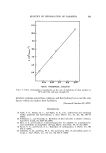
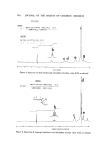
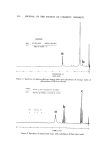
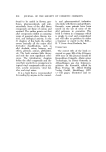
KINETICS OF DEGRADATION OF PARABENS 499 RESULTS AND DtSCUSS•ON All of the rate constants •vcrc calculated from the first-order rate equation. The slopes of the lines were calculated by regression analysis using an elec- tronic calculator.* The effect of pH and temperature on the hydrolysis of the parabens was studied at 3 temperatures and at pH values ranging from 2.75-9.16. The cal- culated values of the rate constants and half-lives at different pH values and temperatures are summarized in Tables II and III. Typical plots showing the hydrolysis of ethyl paraben at 70øC and various pH values and at various temperatures at pH 9.16 are shown in Figs. 1 and 2. These plots indicate that the reaction was first order with respect to ethyl paraben since straight lines were obtained when the log of concentration was plotted against time, which •vas true for each paraben studied. The reaction overall would be pseudo- first order since the concentration of water can be regarded as constant. As shown in Tables II and III and in Figs. 1 and 2, as the pH and tempera- ture increase, the rate of hydrolysis of the parabens increases. One would ex- pect n-butyl paraben to have a lower rate constant than propyl paraben, yet the data shown in Tables II and III show an increase in the rate constants for *Wang model 360K/362K, Wang Laboratories, Inc., Tewksbury, Mass. Table II Specific Rate Constants and Half-life Periods for the Hydrolysis of Parabens at 70øC in 0.1M Phosphate Buffer, Ionic Strength 0.3, at Various pH Values Paraben pH k x 10 a t '/• (hours-•) (hours) Methyl 9.16 30.63 22.6 8.24 17.80 38.9 7.33 10.24 67.6 6.41 2.710 255.0 5.49 0.414 1673.0 Ethyl 9.16 8.877 78.1 8.24 7.667 90.4 7.33 6.540 106.0 6.41 1.203 576.0 Propyl 9.16 7.163 96.7 8.24 5.982 120.0 7.33 4.238 164.0 6.41 0.568 1218.0 n-Butyl 9.16 9.391 73.8 8.24 6.387 109.0 7.83 4.580 15]..0 6.41 1.153 601.0

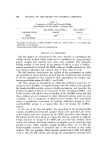
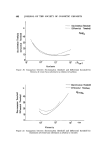
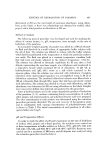
500 JOURNAL OF THE SOCIETY OF COSMETIC CHEMISTS •. 0.6 z r• 0.4 0.2 q 2.75 pH 3.66 4.59 pH6.41 pHZ55 i i 0 i I o 4'0 140 160 TIME IN HOURS Figure 1. Log of concentration of ethyl paraben against time at 70øC in 0.1M phosphate buffer, ionic strength 0.3, at various pH values Table III Specific Rate Constants and Half-life Periods for the Hydrolysis of Parabens at Various Temperatures in 0.1M Phosphate Buffer, pH 9.16, and Ionic Strength 0.3 Paraben Temperature k x-i0 • - -t •a (ø C) (hours-') (hours) M thyl 40 1.941 - Ethyl 40 0.735 943.0 Propyl 40 0.529 1310.0 n-Butyl 40 0.536 1292.0 Methyl 50 5.776 120.0 Ethyl 50 1.752 396.0 Propyl 50 1.205 575.0 n-Butyl 50 1.347 515.0 Methyl 70 30.63 22.6 Ethyl 70 8.877 78.1 Propyl 70 7.163 96.7 n-Butyl 70 9.391 73.8 n-butyl paraben, at the pH's and temperatures used in this study, when com- pared to the values obtained for propyl paraben. At 70øC in 0.1M phosphate buffer at pH 9.16, n-butyl paraben hydrolyzed faster than ethyl and propyl parabens. This phenomenon is difiieult to explain since there is little differ- enee between the activation energies .of the parabens at pH 9.16, as shown in
Purchased for the exclusive use of nofirst nolast (unknown)
From: SCC Media Library & Resource Center (library.scconline.org)