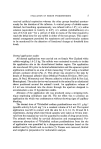
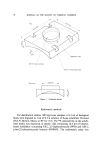
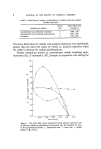
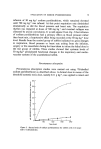
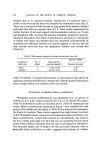
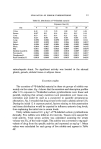
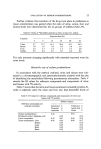
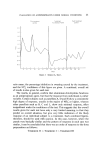
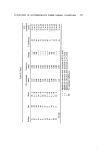
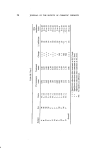
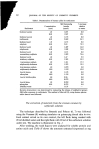
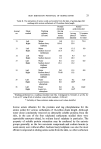
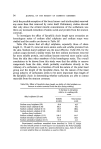
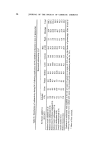
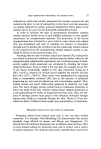
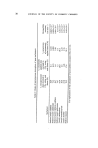
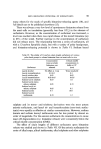
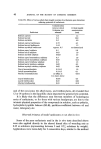
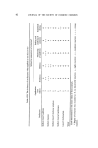
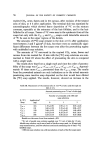
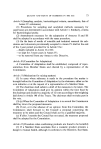
10 JOURNAL OF THE SOCIETY OF COSMETIC CHEMISTS abraded skin as an aqueous solution. During the 4 h exposure time, a profile of the blood serum levels was obtained by radiometric assay (Fig. 3). There was a twenty-five-fold increase in drug serum levels between abraded and intact skin after an exposure time of 2 h. These results emphasized the barrier function of skin and support well-documented evidence, e.g. Cronin and Stoughton (10), showing that abrasion facilitates penetration and per- cutaneous absorption. The extent of percutaneous absorption in the groups of rabbits with intact and abraded skin was quantified radiometrically by estimating the difference between the activity applied to the site and the total activity recovered from the application solution and excised skin (Table II). Table 1I. Percutaneous absorption through abraded and intact skin Quantity applied Condition of No. of Mean quantity % rabbit skin rabbits absorbed (mg kg -x) Quantity absorbed Intact 5 1.346 4-0.795 1.20 Abraded 4 18.363 4-4.012 16.42 Table H indicates a fourteen-fold increase in percutaneous absorption by applying sodium pyridinethione to broken skin, thereby greatly reducing the safety margin before toxic systemic levels are reached. Distribution of labelled sodium pyridinethione asS-labelled sodium pyridinethione was administered to six groups of rabbits as a 0.11 g kg 4 aqueous solution for 4, 8, 12, 16, 20 and 24 h respec- tively for distribution studies as described above. Table 1II summarizes the results. Mean concentrations expressed as mg kg 4 were estimated for each group of five rabbits and this figure in Table III was taken as the representa- tive figure for analysis. These results suggested that rapid urinary excretion of the asS-labelled parent compound and metabolites takes precedence over tissue concentration. A three-fold increase in concentrations was noted in the liver, kidney and lungs over 24 h but was not surprising because blood serum levels similarly increased with the rate of percutaneous absorption. The increased uptake rate of drug in the bile and small intestine, with no detectable levels in the faeces or colon, suggested the existence of a biliary

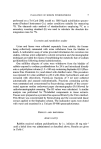
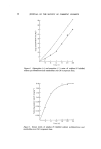
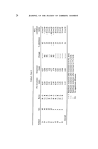
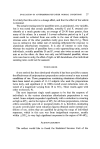
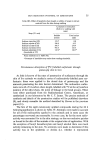
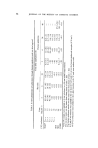
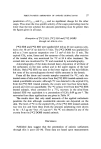
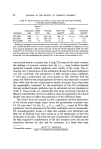
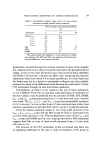
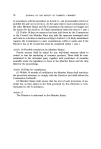
EVALUATION OF SODIUM PYRIDINETHIONE Table Ill. Distribution of asS-labelled material 11 Exposure time (h) Site 4 8 12 16 20 24 Urine 0.49 1.33 2.23 3.88 5.67 6.94 Serum 0.057 0.11 0.14 0.16 0.15 0.16 Liver 0.10 0.15 0.19 0.25 0.22 0.32 Kidney 0.027 0.043 0.043 0.053 0.056 0.10 Lung 0.0052 0.0062 0.0070 0.0071 0.0067 0.014 Heart 0.0025 0.0028 0.0031 0.0046 0.0034 0.0037 Spleen 0.0006 0.0007 0.0006 0.0005 0.0005 0.0006 Brain 0.0014 0.0031 0.0044 0.0080 0.0089 0.0142 Bile 0.0011 0.0021 0.0026 0.0034 0.0041 0.0054 Skeletal muscle/G. 0.0004 0.0003 0.0008 0.0010 0.0009 0.0017 Pancreas/G. 0.0004 0.0006 0.0013 0.0016 0.0012 0.0017 Duodenum/G. 0.0009 0.0006 0.0039 0.0058 0.0059 0.0057 Small intestine/G. 0.0010 0.0009 0.0036 0.0039 0.0054 0.0056 enterohepatic shunt. No significant activity was located in the adrenal glands, gonads, skeletal tissue or adipose tissue. Excretion studies The excretion of asS-labelled material in these six groups of rabbits was mainly via the urine. Fig. 4 shows that the excretion and absorption profiles after 12 h exposure to asS-labelled sodium pyridinethione were linear and parallel, implying that urinary excretion took precedence over tissue con- centration and could be used as a parameter to quantify percutaneous absorption. Fig. 5 revealed that drug serum levels reach a plateau about 12 h. During the initial 12 h exposure period, factors relating to skin penetration and tissue distribution would be expected to influence systemic drug levels, thus explaining the initial rise in serum levels. Thirty rabbits received 0.11 g kg -x of asS-labelled sodium pyridinethione derreally. Five rabbits were killed at 4 h intervals. Tissues were assayed for total activity. Total serum activity was calculated assuming the serum volume was 3•o of the body-weight. The activity was converted to mg equi- valents of drug from the specific activity and expressed as mg kg 4. Mean values were calculated for each group of five rabbits and appear in Table III.
Purchased for the exclusive use of nofirst nolast (unknown)
From: SCC Media Library & Resource Center (library.scconline.org)