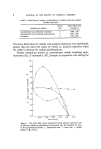
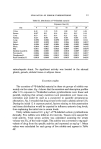
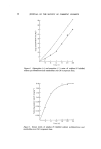
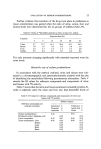
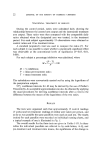
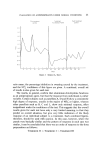
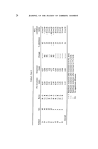
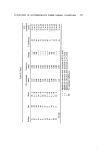
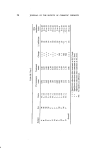
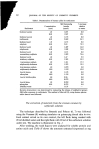
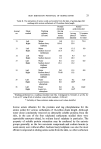
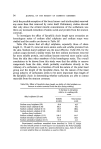
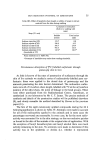
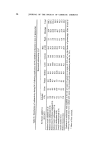
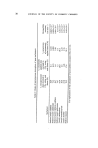
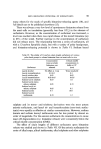
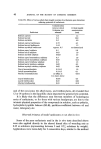
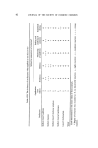
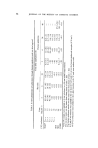
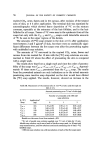
22 JOURNAL OF THE SOCIETY OF COSMETIC CHEMISTS STATISTICAL TREATMENT OF RESULTS During the control period, ratios were calculated daily showing the relationship between the control arm output and the (untreated) treatment arm output. These ratios were then compared with the comparable daily ratios obtained when the designated arm was treated, in the treatment period. For each subject approximately 15 observations were obtained as control ratios and 10 as treatment ratios. A standard (unpaired) t-test was used to compare the ratios (7). For each subject it was possible to state whether a statistically significant effect was observable at the conventional levels of significance (P 0.05, 0.01, 0.001). For each subject a percentage inhibition was calculated, where (p-T) M=-- x100 P M = • inhibition P -- mean pre-treatment ratio T = mean treatment ratio. The calculations were conveniently carried out by using the logarithms of the perspiration outputs. 95•o confidence intervals for M may be derived by the use of Fieller's Theorem (8). An acceptable approximation can also be obtained by applying the usual procedures for deriving confidence intervals after a t-test to the difference between the means of the logarithms of the two ratios. RESULTS The tests were organized such that approximately 15 control readings (3 weeks) and ten treatment readings (2 weeks) were taken per person, and as far as was possible the same panellists were used on each test. The results (ratios) for each panellist were recorded on individual running charts, and a typical example of one is illustrated in Fig. 3. The overall results for the three tests are given in Tablea' I-III. In these tables the individual panellists are referred to by code letters, A-Q, and pre-treatment and treatment ratio means, the significance of the change in
Purchased for the exclusive use of nofirst nolast (unknown)
From: SCC Media Library & Resource Center (library.scconline.org)