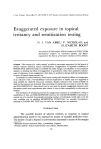
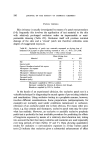
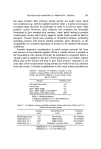
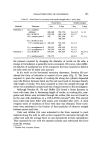
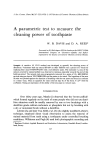
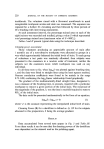
222 JOURNAL OF THE SOCIETY OF COSMETIC CHEMISTS Table 1I. Summation of stain area on Mr Smith Brushing time (s) 0 10 20 40 60 80 Examiner 1 435 323 285 250 181 203 Examiner 2 345 285 228 215 175 170 Each score was total recorded stain for eight incisors. Because, in any cleaning experiment, the examiners would expect a progressive decline in scores, some volunteers were returned at random to examiners for a repeat scoring, without a further brushing. By doing this, the expected tendency of the observers to record lower scores could be quantified. Of 58 repeat observations, 36 were lower and 22 higher than the previous reading and a 9• mean fall in estimated stain area was recorded. This proved to be of the same order as the assessment made when cleaning throughout was done with a non-abrasive gel toothpaste. The initial tests reported here, carried out to prove the technique, used only ten to twenty subjects per group. Despite such small group sizes coefficients of variation for cleaning power were nevertheless within the range 0.4-0.7, except for the non-abrasive paste which had the lowest cleaning power. Even with these small groups of volunteers, differences between the cleaning powers for non-abrasive and chalk-based toothpastes could still be detected. Chalk-based toothpastes were generally the best cleaning agents and as effective as a highly abrasive pumice-based prophylaxis paste. A silica-based toothpaste was almost as efficient with respect to cleaning power as the least effective chalk-based toothpaste. The non-abrasive toothpaste was significantly lower in cleaning power, especially if the quantified expectancy element was taken into account. DISCUSSION The development of the parametric test for dentifrice cleaning power was aimed at producing a test that was quantitative, realistic and reproduci- ble while also being capable of detecting small differences between products. By using this technique on small groups of volunteers, the technique appears of fulfil all these requirements. Furthermore, the training of new operators was a simple process since the expectancy of the scorers could be quantified,

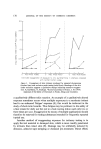
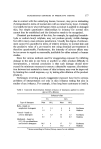
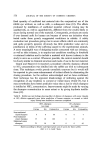
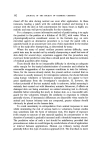
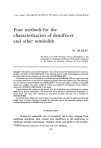
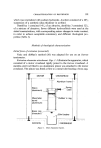
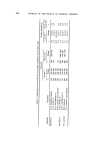
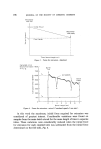
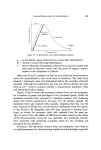
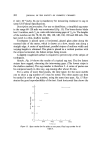
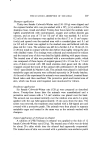
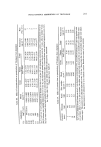
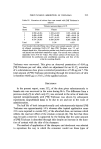
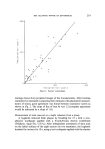
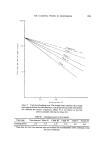
IOOO THE CLEANING POWER OF DENTIFRICES I I 50 IOO Brushing time (s) t:•gure 3. Total stain/brushing time• The straight lines represent the average least squares fit lines for stain reduction with the dentifrices tested. The broken line indicates the scorers' expectancy. (Paste IV is not shown as the line almost coincides with that for Paste II.) Table III. Cleaning powers B of six pastes Paste type Non-abrasive I Silica II Chalk III Chalk IV Chalk V Pumice VI Cleaning power 2.8 5.5 6.1 * 5.6' 8.0 6.0 223 * These data are from two separate tests and confirm the reproducibility of the technique using the same toothpaste.
Purchased for the exclusive use of nofirst nolast (unknown)
From: SCC Media Library & Resource Center (library.scconline.org)