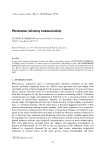
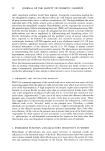
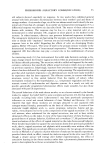
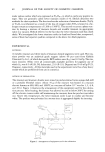
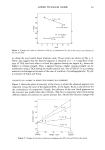
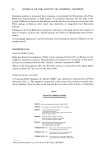
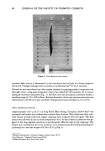
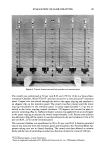
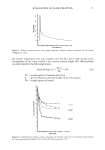
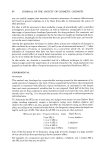
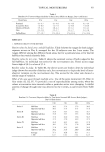
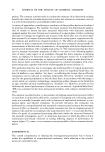
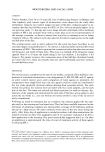
LOWER TITANIUM OXIDE 61 METHODS FOR TEST The following procedures were carried out in order to characterize the synthesized ma- terials: a) X-Ray diffraction.' Crystallographic assessment of the products was carried out using a Rigaku Denki X-ray diffractometer (RU-3) by Cu-K• radiation. b) Color measurement.' A CC-1 Color Computer (Tokyo Shibaura Electrics), a visible light absorption spectrometer equipped with a minicomputer, measured the color of the products and that of 10 per cent mixtures in TiO• # 328. The latter is for assessing the tinting strength of the products. The L-value in the Hunter's equation, which expresses lightness, will be used for referring to the blackness and tinting strength of the products. Other chromatic values such as hue (= b/a) and saturation [ = (a • + b 2)•/2 ] were of no use since the products were achromatic. c) Viscosity and superficial appearance of a slurry.' Products were mixed with TiO• # 328 at the ratios 0/100, 15/85, 25/75, 50/50, 75/25, and •00/0 using an Emide mixer. The mixture (70 g) was dispersed into a tetradecane-sorbitan monooleate 34/4 v/v solution, which was passed through a three-roller mill. Viscosity of the slurries was measured with a Ferranti-Shirley cone-plate viscometer under the condition to give a maximum shear rate of 1720 sec -• with a 10 sec sweep time. Apparent viscosity was obtained from the shear stress at the maximum shear rate. Attention was paid to the appearance of the slurry surface throughout this experiment. RESULTS AND DISCUSSION OPTIMUM CONDITION FOR SYNTHESIS In order to determine the shortest time required for the calcination reaction to be com- pleted, the existence of unreacted starting materials such as TiO2 and Ti in the product was examined by X-ray diffraction. Figure 2 shows an example of the results in which one can note the progress of the reaction. With time, the diffraction peaks of the start- ing materials decreased in intensity and the intensity of the end product increased. Figure 2 indicated that the reaction had been completed after 4 hr. Table I summarizes the time required for the completion of the reaction at different temperatures. Table I Heot T T,ton,um Treolment After Ihr a! 800C 2hrs al T 3 P3 T,•O• 800C R 2 2 n Afte• p3 • p2 20 30 40 Bragg's Angle (2•), Degree Figure 2. An example of the change in X-ray diffraction patterns with time for a Ti - TiO2 mixture

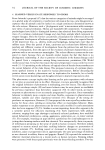
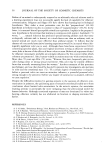
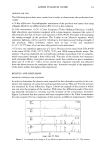
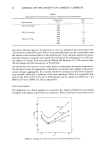
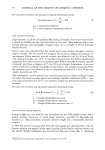
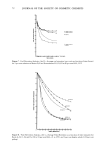
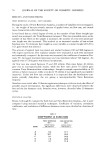
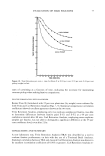
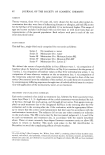
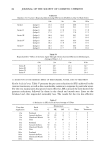
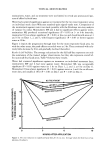
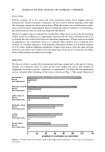
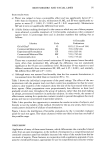
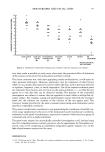
62 JOURNAL OF THE SOCIETY OF COSMETIC CHEMISTS Table 1. Time required for the reaction to come to completion at each temperature. Temperature Time Raw materials (øC) (hr) TiO2 (54.0 m2/g) 600 4 800 1 1000 1 TiO= (25.0 m•/g) 600 20 800 4 1000 1 TiO2 (8.5 m•/g) 600 20 800 20 lOOO 20 also shows that the time for the reaction to come to completion becomes longer with decreasing Ss= of the TiO= used. This is understandable based on the consideration that the reaction rate becomes faster as the particle size of the starting material decreases, since the decrease in particle size causes the lowering of the melting point or of the lat- tice defects of crystals. This was noted by Kelvin and Herring (5,6). The reaction time did not change with the mixing ratio of Ti and TiO2. As well known, the reaction can be made faster by raising the calcination temperature, but the latter causes the aggregation of particles by sintering. Since higher temperature causes stronger aggregation, the reaction should be conducted at the lowest tempera- ture possible within the conditions of the time stipulated. Thus, it is reasonable that each of the TiO= of P-25, P-110, or #328 grades can be calcined at 600øC for 4 hr, 800øC for 4 hr or 1000øC for 20 hr, respectively. TESTS FOR PIGMENTS For application as a black pigment in cosmetics, the degree of blackness and tinting strength of the pigment should first be examined. These conditions were studied so as 24 •, 23 -- 22 o TiO2 (A)/ 2 3 4 n Figure 3. Change of L-value as a function of n for the synthesized TinO•n-•
Purchased for the exclusive use of nofirst nolast (unknown)
From: SCC Media Library & Resource Center (library.scconline.org)