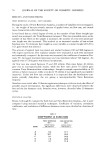
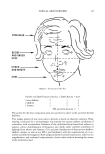
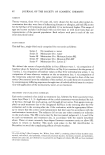
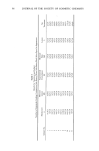
TOPICAL MOISTURIZERS 83 Table I Baseline (No Treatment) Reproducibility by Facial Area SFL Score Ranges, Day 0 (All Series) Facial Area 0 hr 3 hr 6 hr 10 hr Forehead 4.1-4.7 4.1-4.6 4.1-4.6 4.1-4.6 Around the Eyes 7.4-8.0 7.2-7.9 7.2-8.0 7,4-8.0 Cheek and Mouth 3.9 -4.2 3.8-4.2 3.9-4.1 3.9-4.2 Chin 2.3-2.8 2.2-2.7 2.2-2.7 2.2-2.8 Full half-face 17.7-19.7 17.3-19.4 17.4-19.4 17.6-19.6 RESULTS 1. REPRODUCIBILIT¾ OF THE METHOD Baseine values by facial areas and full half-face. Table I shows the ranges for both judges' separate scores on Day 0, averaged for the 20 subjects over the 5-test series. The ranges differed among the different facial areas, but for a particular area or for the full half-face they varied relatively little. Baseline values by test series. Table II shows the summed scores of both judges for the full half-face, by individual test series for the no-treatment day. These scores range from a high of 38.3 to a low of 35.4. Baseline values by judge. In Table III, the above scores are broken down by individual judge (shown for one side of the face only, for convenience) to depict the level of inter- observer variation on the no-treatment day. The scores for the other side showed a similar range of variation. Effect of the same agent through multiple series. Use of the same moisturizer (O, Olay) in four series (II, III, IV, V) provided a test of reproducibility among series, when the values at successive time intervals within a particular series were changing. A similar pattern of change through time was detected in the 4 series, as can be seen from Table IV. Table II Baseline (No Treatment) Reproducibility by Test Series Summed SFL Scores (Both Judges), Day 0 of Each Series 0 hr 3 hr 6 hr 10 hr Series I Half-face 38.3 37.9 37.9 38.2 Opposite half-face 38.1 37.9 37.5 37.6 Series II Half-face 35.9 35.5 35.4 35.7 Oppo sire h alf-face 35.9 35.5 35.5 36.0 Series III Half-face 37.0 36.0 35.8 36.5 Opposite half-face 37.2 37.0 36.9 37.2 Series IV Half-face 36.9 36•2 36.3 37.0 Opposite half-face 38.1 37.9 37.8 38.0 Series V Half-face 37.0 36.3 36.2 36.9 Opposite half-face 38.2 37.9 38.0 38.0 Average 37.3 36.8 36.7 37.1 +- SD +-2.7 -+3.1 +-3.1 +-2.5

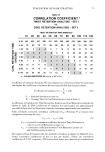
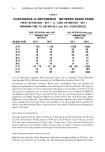
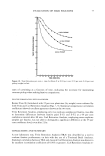
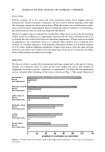
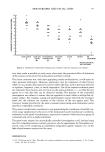
84 JOURNAL OF THE SOCIETY OF COSMETIC CHEMISTS Table III Baseline (No Treatment) Reproducibility by Judge SFL Scores (Half-Face), Day 0 of Each Series 0 hr 3 hr 6 hr 10 hr Series I (Judge 1) 19.2 19.0 18.8 19.1 (Judge 2) 19.1 18.9 19.1 19.1 Series II (Judge 1) 18.0 17.8 17.6 17.8 (Judge 2) 17.9 17.7 17.8 17.9 Series III (Judge 1) 18.8 18.3 18.1 18.5 (Judge 2) 18.2 17.7 17.7 18.1 Series IV (Judge 1) 18.7 18.4 18.4 18.6 (Judge 2) 18.2 17.8 17.9 19.1 Series V (Judge 1) 18.9 18.7 18.4 18.4 (Judge 2) 18.1 17.7 17.8 18.1 Table IV Reproducibility--Effect of the Same Agent Through 4 Series Summed SFL Scores (Both Judges), Average of Days 1, 2, 3 0 hr 3 hr 6 hr 10 hr Series II 36.5 28.7 29.1 34.7 Series III 37.8 29.3 29.9 36.0 Series IV 37.6 29.6 30.0 35.7 Series V 38.1 29.9 30.4 36.4 II. SENSITIVITY OF THE METHOD: EFFECT OF MOISTURIZERS, WATER, AND NO TREATMENT Results by facial area. Table V presents the per cent reductions in SFL's achieved by the various treatments, as well as the considerable variation in response by particular areas. For the two moisturizers that proved more effective, SFL's around the eyes showed the greatest reductions, followed by those in the cheek and mouth area. Lines on the forehead and chin responded noticeably less. The results for the two less effective Table V % Reduction in SFL's by Facial Area Average of 3 Days Moisturizers Time after Facial No Application Area O ML MF L Water Treatment 3 hr Forehead 8 4 3 3 1 0 3 hr Around the Eyes 32 20 8 5 7 2 3 hr Cheek and Mouth 26 15 7 5 7 2 3 hr Chin 9 6 10 7 4 4 6 hr Forehead 8 3 3 2 1 0 6 hr Around the Eyes 30 16 7 4 5 2 6 hr Cheek and Mouth 23 11 5 5 6 2 6 hr Chin 7 6 7 6 3 3 10 hr Forehead 3 1 1 1 0 0 10 hr Around the Eyes 6 3 2 0 0 1 10 hr Cheek and Mouth 6 2 1 0 1 10 hr Chin 1 3 4 1 0 3
Purchased for the exclusive use of nofirst nolast (unknown)
From: SCC Media Library & Resource Center (library.scconline.org)