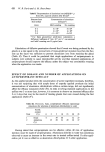
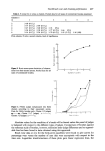
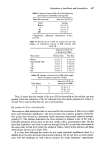
410 D. C. Cullum First the ratio of weights from right and left axillae was calculated for each individual pair of pads. To assess the between-subject variation, the mean ratio was calculated for B and C pads separately for each of the 10 days of the test, together with its standard deviation. To simplify assessment of constancy the coefficient of variation (CV), i.e. the standard deviation expressed as a percentage of the mean, was also calculated. The results are summarised in Table V. Table V. Between-subject variation in R: L ratio Day 1 Day 2 Day 3 Day 4 Day 5 B C B C B C B C B C Week Mean 1'11 1-04 1.20 1.00 1.12 1.06 1.21 1.19 1'07 1.15 1 S.D. 0.30 0'23 0'45 0'24 0'29 0'28 0-29 0-36 0'18 0-20 CV 27•o 22•o 385/o 24% 26• 26% 245/o 30•o 175/o 18% Week Mean 1.08 1.04 1-05 1.09 1-06 1.10 1.07 1.12 1.13 1.08 2 S.D. 0.35 0.20 0.27 0-27 0.27 0.20 0.24 0.26 0.21 0-26 CV 32• 19•o 26•o 25•o 25•o 19•o 22•o 23•o 18•o 24% The mean coefficient of variation was 25•o in Week 1 and 23•o in Week 2. The lowest individual value of the R: L ratio was 0.57 and the highest 2.39. To assess the within-subject variation the mean ratio, with its standard deviation and coefficient of variation, was calculated for the five B and five C pads separately for each week. For these figures the mean coefficient of variation was 15•o in Week 1 and 12}/o in Week 2. The variation within one subject on different occasions is therefore appreciably less than the variation between subjects on one occasion. In practice, however, one uses the mean value for the B and C pads together, and for simplicity Table VI shows only the R: L ratio for the combined B and C pad weights. Table VI. Within-subject variation in R: L ratio Week 1 Week 2 Subject No. Day 1 Day 2 Day 3 Day 4 Day 5 Day 1 Day 2 Day 3 Day 4 Day 5 53 1.08 1.12 1.12 1.00 1.21 1.13 1.13 1.28 1.21 1.21 38 0.72 0.99 1.29 1.89 1.03 0.77 0.77 0.90 1.04 0.84 339 0.95 0.90 0.83 0.99 1-04 0.94 0.81 0.85 0.89 0.93 42 1.18 0.91 1.22 1.32 1.32 0.97 1.21 0.72 0.87 1.09 350 -- 1.03 1.20 1.08 1.04 m 1.78 1-48 1.76 1.75 208 0-83 0.76 0-76 0.83 0.79 0.78 0-80 0.85 0.77 0.77 163 0.91 0-98 1.04 1.05 1.13 1-01 1.14 1.25 1.31 1.16 338 0.86 1.68 0.95 1.28 1.00 0.91 0.88 0-93 0.92 1.20 194 1.13 1.36 1.51 1.41 1.27 1.80 0.96 1.07 1.03 1.11 275 1.12 1.28 0.96 1.61 1.24 1.06 1.25 1-22 1-05 0.96 7 1.33 1.15 1-38 1.39 1-41 1.17 1.24 1.37 1.37 1.25 138 1.04 1.06 1-05 0.99 1.14 1.01 0.97 1.02 1.10 1.07 248 1.78 1.75 1.64 1.47 1.38 1.40 1.27 1.23 1.27 1.20 80 1-14 1.05 1-06 1.28 1-00 1.08 0.93 1.05 1.02 0.93 285 0.97 0.79 0.74 0.75 0.96 1-17 1-06 1.16 1.00 1.10 322 -- 0.80 0.75 0.91 0.81 0.78 0.97 0.95 1.02 1.15 It is not the purpose of this paper to enter into contention with other evaluation scientists two conclusions are, however, inescapable if these sixteen women are accepted

Rapid hot-room testing of antiperspirants 411 as being reasonably representative of the population at large. The first is that since ninety-nine of the 157 ratios given in Table VI differ from unity by 10•o or more, in either direction, the ratio of weights from treated and untreated sides cannot be regarded as a satisfactory estimate of the efficacy of a product in an individual subject. The draft report of the OTC panel (1) advocates the use of the proportion of subjects in which this very parameter has a value of 0.80 or less as a measure of the efficacy of an antiperspirant. It is obvious that, given a reasonably large number of subjects, this proportion will increase as the efficacy of the treatment increases. Nevertheless it cannot be too strongly emphasised that the ratio of weights from treated and untreated sides does not, by itself, give any indication of the efficacy of a product in an individual subject. Majors and Wild (4) recognise this fact and in their method of analysis they seek to correct for the error by measuring the change in the ratio from the value in the absence of any treatment to the value when one side is treated with the test product, i.e. the no-treatment value in an individual is used as a control. Inspection of Table VI shows that the value of the ratio on one day is an unreliable estimate of its value on a subsequent day. In other words the 'pre-test' ratio is not a good estimate of what the 'post-test' ratio would be if the treatment had no effect, i.e. it does not adequately fulfil the role of a control. The second conclusion, therefore, is that the comparison of pre- and post-test ratios is not a valid means of assessing the efficacy of a product in an individual subject. In the absence of a real antiperspirant effect, however, one would expect half the post-test ratios to be greater than the corresponding pre-test ratios and the other half to be less. A significant shift from a 50: 50 split is therefore valid evidence of an effect. SUMMARY AND CONCLUSIONS The basic criteria which an evaluation procedure must satisfy are these. It must not show spurious effects in the total absence of an effect, i.e. the test and control substrates must behave in the same way when neither receives any treatment. It must not show spurious differences in the presence of a constant effect, i.e. the test and control substrates must behave in the same way when both receive the same active treatment. It must succeed in showing an effect, and must do so with acceptable reproducibility, when test and control substrates receive treatments of different efficacies. It must be free from systematic error or bias. The test conditions and protocol must be designed in such a way that the results contain the desired information. We have shown that a three-day adaptation of the 'SSEM' method of Wooding and Finkelstein satisfies these criteria and that the elimination of bias has been satisfactorily accomplished without the need for a cross-over design. Because the simple ratio of sweat weights from test and control sides is an unreliable index of the efficacy of a product in an individual subject, we have avoided the use of the parameter advocated by the FDA's OTC Panel, i.e. the proportion of subjects in which the per cent effect exceeds 20•o. In every other detail of protocol and experimental procedure, however, the method fulfils the requirements of that body, as set out in its Draft Report (1). In other respects the method is neither better nor worse than other hot-room pro- cedures. It is certainly not in any sense definitive it yields one particular kind of in- formation, namely the efficacy of one product relative to another after three consecutive once-daily applications and under a particular set of experimental conditions. A greater or smaller number of applications, or an increased frequency of application, or different
Purchased for the exclusive use of nofirst nolast (unknown)
From: SCC Media Library & Resource Center (library.scconline.org)