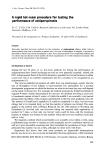
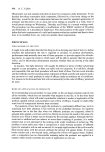
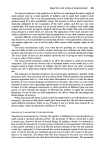
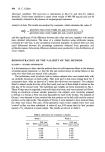
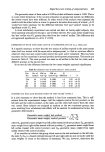
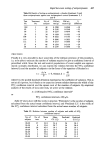
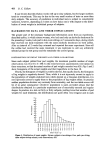
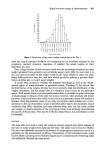
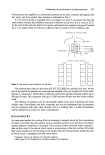
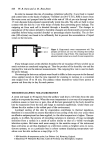
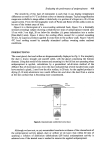
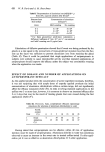
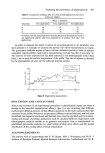
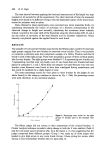
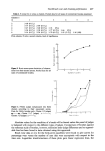
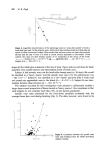
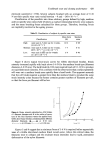
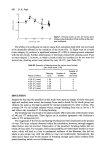
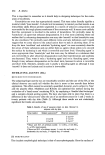
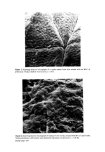
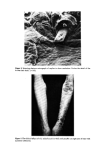
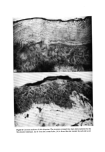
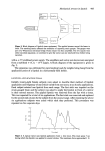
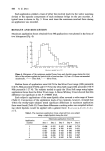
Evahtation of emollients and keratolytics 435 the test site is photographed so as to give a final magnification of five to eight times. We decided to employ this technique in the evaluation of one emollient. In order to quantify any changes we arranged to measure the width of the skin furrows at five sites chosen in a standardised way by placing the photographs under a template. To remove all bias the photographs were coded and the observer who performed the measurement had no knowledge from which subject or treatment group the photographs came. For the actual measurement a x 8 magnifying lens with built in measuring graticule was used. This experiment was performed on six individuals with normal skin and six with dry skin and was over a 4 h period after application of an emollient (Table II). Table 1I. Skin furrow width determined from photographs in six normal and six 'dry skin' subjects Time (min) Furrow width (mm + S.D.) Dry skin subjects Normal subjects Control 1.41 + 0.20 1.34+ 0.19 0•' 1.51 +0.16 1.54+0.16 30 1.80 + 0.37* 1.54+ 0.21 60 1.57+0.11 1.54+0.12 120 1.52+0.16 1.37+0.15 240 1.77+ 0.40 1-43 + 0.26 * Difference from control (P =0.05) •' Immediately after application I do not know why furrow width decreases after hydration but there seems to be little doubt that it does and this can serve to give a quantitative index of hydration effect. Scanning electron microscopy (SEM) has been used by several groups including ourselves to assess the effect of hydrating agents (3, 4). In our experience SEM of skin surface replicas or skin surface biopsies (4) can certainly detect alterations after application of HA but they are difficult to quantify. The most prominent change in replicas is the 'filling up' of the normal surface furrows (Fig. 1). In addition, individual cell margins are more prominent and the cells appear plumper (Fig. 2). Because this is a very cumbersome (and costly) technique and gives no quantitative data, it is, however, best to choose another way of testing HAs. (C) SURFACE CONTOUR ANALYSIS Replicas of the skin surface show quite marked changes after application of HA. The replicas that we now employ reproduce the surface contour with an astonishing resolu- tion (Fig. 3). We use 'Silflo' dental impression material (a silicone rubber material) for the negative and we then coat the negative with 'DPX' (a styrene plastic slide mounting medium). The 'positive' is dried in a desiccator overnight and then separated from the 'negative'. After separation the positive is mounted on a glass microscope slide and subsequently its surface contour is traced using an instrument known as a surfometer (6). The stylus of this instrument barely indents the surface and the excursions of the stylus give an accurate representation of the surface contour of the specimen. All the HAs tested in this system show a decreased contour profile in the few hours following their use. The decrease in contour profile is consistent and time dependent but not dramatic. In one series of tests six normal volunteers and six volunteers with 'dry' but otherwise normal skin used a popular (oil in water emulsion lotion) on the lower legs and replicas

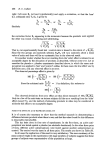
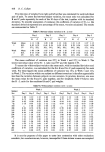
436 R. Marks were taken at intervals for up to 4 h subsequent to application. The results are shown in Table III. Table Ill. Surfometric areas (cma+S.D.) for six normal and six dry skin subjects after application of an HA Areas (cma+ S.D.) in tracing from replicas Time (rain) Normal skin Dry skin Before 9-2+3.2 10.5+2.0 Immediately after 7.9 + 2.6 10.1 + 3.7 30 7.8+2.8 9.1+2.4 60 7.4+1.1 8.8+3.2 120 6.7+ 1 '7 8-0+2-4 240 6.9+3.1 9.0+1.8 Interestingly the maximum effect has always been, whatever HA we use, between 2 and 4 h and rarely results in more than a 25• decrease in area under the contour traced. A more interesting and fundamentally more important question is whether HAs effect any cumulative change in the stratum corneum after persistent use. In one experiment a HA was applied twice daily for 28 days to the forearm of five normal volunteers and the replicas were taken at a constant time of the day after the last application. The results are given in Table IV. Table IV. Area (cm • + S.D.) under contour tracings from replicas taken from five normal subjects at different times after application of HA. Application stopped at 28 days Time (days) Area (crn • +_ S.D.) 0 10'78_+ 1.56 2 9'68+ 1.12 7 9-32+0.77 14 8.68+0.91 21 9'66+ 1.27 28 9-16+0'8 33 (5, after treatment) 9' 5 + 2.28 Although the maximum change is seen at the surface, HAs also influence the internal structure of the stratum corneum (SC) and alterations in contours of the ruptured internal face of skin surface biopsies can be detected In Table g the results of immersing the lower leg in water containing a bath oil for six volunteers with normal skin are shown. Skin surface biopsies (5) (SSBs) were taken before and at intervals after the period of exposure (20 rain). Table VI is directly comparable to Table III as it is taken from the same experiment but documents the effect of SSBs rather than from replicas. Interestingly the trend to reduction in area is more noticeable in the normal individuals but does not reach statis- tical significance. Similarly some effect can be determined on SSBs after 14 days application of an aqueous cream. Table VII shows results obtained in the same experiment as outlined for Table I.
Purchased for the exclusive use of nofirst nolast (unknown)
From: SCC Media Library & Resource Center (library.scconline.org)