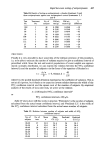
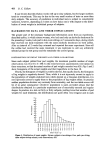
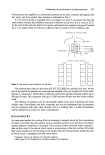
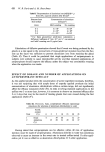
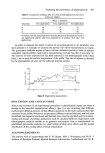
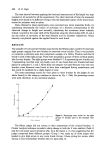
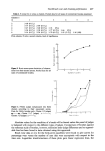
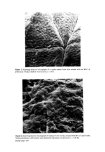
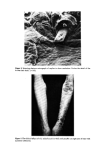
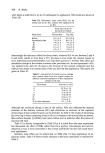
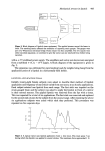
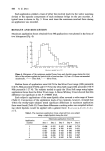
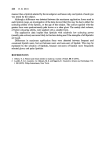
404 D. C. Cullum Hot-room conditions. The hot-room is maintained at 40+ IøC and 40+2•o relative humidity. Under these conditions a mean sweat weight of 400-500 mg per pad can be consistently obtained in the absence of antiperspirant treatment. Analysis of data. The results are analysed by computer, which calculates the value of 100(1 -- geometric mean sweat weight per pad, test product geometric mean sweat weight per pad, c-•nt•-•ol p--•-oduct'/ and the significance of the difference between this value and zero, together with certain more detailed information. The value of a similar function using arithmetic means, corrected for side bias, is also calculated, at present manually. In general there are only small differences between the percentage reductions obtained from geometric and arithmetic means. Substantial differences indicate some peculiarity in the distributions of sweat weights. DEMONSTRATION OF THE VALIDITY OF THE METHOD PLACEBO 1L PLACEBO EXPERIMENTS It is first necessary to show that the method does not yield spurious effects in the absence of antiperspirant treatment, i.e. that the test and control arrays of axillae behave in the same way when both are treated with a placebo. The preliminary work involved a test on sixteen subjects who were treated daily with an alcoholic deodorant on both axillae. They took part in hot-room sittings daily for 5 consecutive days. After an interval of 2 weeks the whole test was repeated. Two subjects failed to attend on the first day of the first week, and one of them failed to attend on the first day of the second week. The individual pad weights are those illustrated in Fig. 1. These 10 days may be regarded as ten individual mini-tests, and were analysed as follows. Using an electronic random number generator, the subjects were randomly assigned to Group 1 or Group 2. This was done separately for each of the 10 days. The subjects of Group 1 were deemed to have received the test product on the left axilla and the control product on the right axilla. The subjects of Group 2 were deemed to have received them the other way round. The ratio of the geometric mean sweat weights from 'test' and 'control' axillae was then calculated. A value of, say, 0.95 meant that the 'test' product caused a 5•o reduction in sweat output. The results are shown in Table I. Table I. Calibration test of placebo v. placebo Week 1 Week 2 GM 'test' Day Ratio Day GM 'control' GM 'test' Ratio GM 'control' 1 o.884 1 1.041 2 0.915 2 0.983 3 1.078 3 1.037 4 1.026 4 0.923 5 1.009 5 1.109

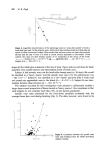
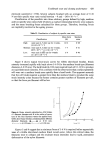
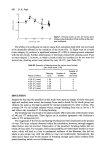
RaoeM hot-room testing of antioeersoeirants 405 The geometric mean of these ratios is 0.998 and their arithmetic mean is 1.0130. This is to some extent fortuitous if the random allocation to groups had turned out differently the results would have been different. In other words if the analysis were repeated the results could be either better or worse. In general a deviation from unity of at least + 0.15 would have been necessary for the difference between 'test' and 'control' means to be significant at the 5•o level. A more satisfactory experiment was carried out later on twenty-eight subjects, who were randomly allocated to Groups 1 and 2 before the test. The mean sweat weight from the 'test' axillae was 4•o greater than that from the 'control' axillae. This difference did not approach significance (t=0.83, P 0'25). EXPERIMENTS WITH THE SAME ACTIVE ANTIPERSPIRANT ON ALL AXILLAB It is equally necessary to show that the two arrays of axillae respond to the same extent when both are treated with the same active antiperspirant, i.e. that no spurious effect is observed when test and control sides receive the same active treatment. This has been necessary on four occasions in normal product development programmes. The results are shown in Table H. The same product was used on all axillae in the first two tests, and a different product in the second two. In no test did the difference between the two mean weights approach significance. Table H. Calibration test of active control v. active control Test No. of GM wt. GM wt. • No. subjects 'test' (g) 'control' (g) difference t 23A 49 0.3780 0.3940 -4 1.05 0.25 75 24 0.3568 0.3566 0 0.01 0.25 82 22 0.2936 0-2800 +5 0.53 0.25 102 26 0.1864 0.1952 -5 0.80 0.25 SYSTEMATIC BIAS AND ELIMINATION OF THE •SIDES' EFFECT It is also necessary to show that the method is free from systematic bias. This is self- evident from the experimental design: half the subjects receive the test product on the left side and the control product on the right, and the other half receive them the other way round. Since subjects are assigned at random to the two treatment groups, any error resulting from unbalanced side effects will be random. In mathematical terms, the parameter determined is Geometric mean weight, test product •/T•. TR Geometric mean weight, control product = • • where Tx., geometric mean weight from left axillae treated with test product TR, geometric mean weight from right axillae treated with test product Cx., geometric mean weight from left axillae treated with control product and Ca, geometric mean weight from right axillae treated with control product. If we consider in isolation the group which receives the test treatment on the left side, the ratio T•./C•t is a biased estimate because left and right sides do not normally yield the same weights of sweat in the absence of treatment. We can, however, determine the
Purchased for the exclusive use of nofirst nolast (unknown)
From: SCC Media Library & Resource Center (library.scconline.org)