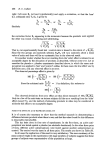
406 D. C. Cullum right: left ratio Rx (at least hypothetically) and apply a correction, so that the 'true' (i.e. unbiased) ratio Tx/Cx is given by Tx _ Rx Tx. Tx. Tx •, or -- C• C• C• C• R• Similarly TR T•R•. Cx. C•. the correction factor Rx appearing in the numerator because the products were applied the other way round. Combining and substituting, •/TL TR __ T• R•. C L C R • C •.
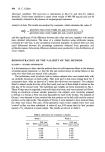
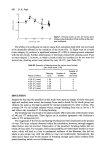
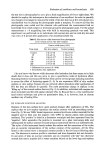
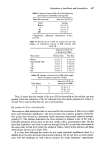
•Tx Rx That is, our experimentally found test: control ratio is biased to the extent of v'R•./Rx. Since the two groups are randomly selected, R•/Rx will vary randomly about a mean value of unity and there will be no systematic bias in the observed result. It is another matter whether the error resulting from the 'sides' effect is reduced to an acceptable degree by the allocation of products as described, without cross-over. Let us consider the placebo v. placebo experiments described above, in which the same anti- perspirant was applied to 'test' and 'control' axilhe. In these cases the true effect was by definition zero, and any observed effect is an error. The observed percentage effect is given by 100 (1 /TLT• / = 100 (1-x/TxT•.R•.) --¾CL CR / •11 C•. Rx Since the unbiased ratio Tx T•. Cx C•. -- 1 by definition, this reduces to The observed deviations from zero effect are thus direct measures of 100x/(R•./R0. Only in a few of the mini-tests on sixteen subjects did the error resulting from the 'sides' effect exceed 5•o, and the method of allocating products to sides may be considered to minimise this effect to an acceptable degree. POSITIVE EFFECTS AND REPRODUCIBILITY It is of course also necessary to show that the method succeeds in demonstrating a difference between products when there is one, and that the value found for this difference is reasonably reproducible. This has been done in four sets of experiments. In the first three, an active anti- perspirant was tested against a placebo (an alcoholic deodorant). In the other three pairs of tests, different active antiperspirants were tested against another antiperspirant as control. The control was the same in all three pairs. The results are shown in Table III. In all cases the replication of the result is very satisfactory. The near-constancy of the mean control weight in the experiments with large numbers of subjects suggests that these groups of subjects were representative of the population at large.

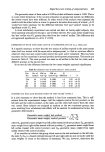
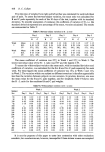
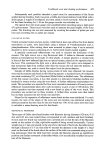
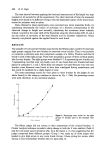
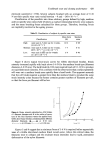
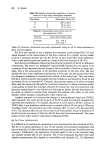
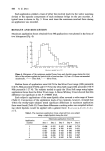
Rapid hot-room testing of antiperspirants 407 Table 1II. Results of testing an antiperspirant v. placebo (treatment 1) and three antiperspirants against one antiperspirant control (treatments 2, 3 and 4) Test Treatment No. of GM wt., GM wt., •o No. No. subjects test (õ) control (õ) difference 23E 1 48 0'2590 0'4240 --39 92 1 28 0-2156 0'3348 --35 96 1 22 0-2257 0'4079 -45 39 2 34 0'1624 0.1925 --16 100 2 42 0-2622 0.3185 - 18 110 3 57 0'2096 0.2823 -26 112 3 80 0.2317 0.3058 -24 37 4 46 0'1524 0.2138 --29 68 4 56 0-2279 0'3080 --26 PRECISION Finally it is very desirable to have some idea of the intrinsic precision of the procedure, i.e. to be able to estimate the number of subjects required to give a confidence interval of prescribed width. Since the test and control populations of sweat weights are approxi- mately normally distributed, we can express the relation between the 95• confidence interval A and the number of subjects n in the form of the equation of Student's t: t-- A•/n •4, whenceA - 4S s where S is the pooled standard deviation expressed as the coefficient of variation. This is not at all rigorous, but it leads us to expect an inverse relation between the width of the 95• confidence interval and the square root of the number of subjects. By empirical analysis of the results of sixty-nine tests, we arrive at the relation n---- (120/required 95•o confidence interval) a or 95•o confidence interval= 120/•/n. Table IV shows how well this works in practice. 'Predicted n' is the number of subjects calculated from the actual mean confidence interval, and 'Predicted C.I.' is the width of the 95•o confidence interval calculated from the actual mean number of subjects. Table IV. Relation between number of subjects and width of 95% confidence interval No. of No. of Mean Mean Predicted Predicted subjects tests n C.I. (•o) n C.I. (•) 20-29 37 24.8 24-6 24 24.1 30-39 8 33.0 20'7 34 20'9 40-49 10 42.8 19.1 39 18.3 50-59 9 52-7 15.7 58 16'5 60-69 1 68.0 12.6 91 14.6 70-79 2 75.0 12.9 87 13.9 80-89 2 84.0 11.7 105 13.1
Purchased for the exclusive use of nofirst nolast (unknown)
From: SCC Media Library & Resource Center (library.scconline.org)