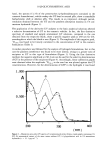
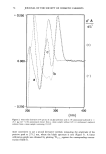
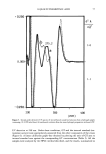
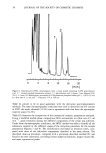
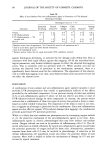
70 JOURNAL OF THE SOCIETY OF COSMETIC CHEMISTS mulations (creams and hydrophilic gels), and the results were compared with those obtained by a reference HPLC method. EXPERIMENTAL MATERIALS 18 •-Glycyrrhetinic acid (GT) was obtained from Aldrich Chemie (Switzerland) and glycyrrhetinic acid phytosome (GTP) from Indena (Gruppo Inverni della Beffa, Italy). Testosterone acetate (internal standard) was from Sigma (St. Louis, MO). Methyl, ethyl, propyl, and butyl p-hydroxybenzoates, butylhydroxyanisol (BHA), butylhydroxytoluol (BHT), and sodium dehydroacetate were supplied by Formenti (Italy). Imidazolidinyl urea (IMU) was from Medolla (Milan, Italy). Acetonitrile was obtained from Promo- chem (F. R.G.), and water was deionized and double-distilled. Aqueous 0.02 M phosphate buffer solutions (pH 3.0) were prepared by mixing potas- sium dihydrogen phosphate and phosphoric acid solutions in the proportion required to give the desired pH value. The GT (0.5 mg ml-•) and GTP (1.5 mg ml-•) stock solutions in 1% ammonium hydroxide and methanolic 1% potassium hydroxide were found to be stable for more than one month at room temperature. The testosterone acetate solution (0.1 mg ml-•) was prepared in the mixture acetoni- trile:phosphate buffer (0.02 M pH = 3.0) 60:40 (v/v), as were the solutions of the single preservants and antioxidants. APPARATUS All the spectrophotometric analyses were performed on a Jasco UVIDEC-610 double- beam spectrophotometer, using 1-cm quartz cells with a slit width of 2 nm. The working settings were scan speed 100 nm min- • and chart speed 20 nm cm- • over the range 500-200 nm. For the derivative mode, A}X = 5 nm was selected, and absorbance scale expansion x 5 (first derivative mode) and x 15 (second derivative mode) were used. The HPLC apparatus consisted of a Waters 501 solvent delivery system, an on-line ERMA ERC-3312 degasser, a Rheodyne sample injection valve with a 20-}xl sample loop, a variable wavelength UV detector (model 481), and a data module 745. The detector wavelength was set at 248 nm, with the integrator attenuation at 16. A 250 x 4.5-mm I.D. column packed with 5-}xm Hypersil C18 was used at ambient temperature, using as mobile phase a binary mixture consisting of acetonitrile:0.02 M potassium phosphate buffer (pH = 3.0) 65:35 (v/v) or 60:40 (v/v) at a flow rate of 1.2 --1 ml min CALIBRATION GRAPHS First derivative method. The zero order UV spectra of GT (7.2-36 }xg ml-•) and GTP (30-150 }xg ml -•) standard solutions in 1% ammonium hydroxide were recorded, using 1% ammonium hydroxide as the blank. The first order spectrum was then derived. The amplitude of the negative peaks at }k = 248 nm and }k = 246.4 nm to the zero line, 1D248 and 1D246.4, were measured for GT standard solutions and GTP

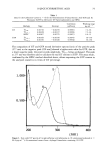
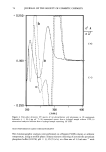
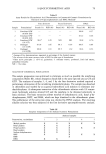
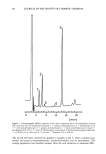
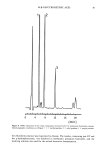
18 [3-GLYCYRRHETINIC ACID 7 ! standard solutions, respectively. The amplitude values were then plotted against the corresponding GT and GTP concentrations to obtain the calibration graphs. Second derivative method. The GT (7.2-36 •g ml -•) and GTP (30-150 •g ml -•) analytical solutions were prepared in 1% methanolic potassium hydroxyde. The zero- order UV spectra of the solutions were recorded against the solvent blank, and the second-order UV spectra were then derived. The amplitude of the positive peak at 275.2 nm (2D275.2) to the zero line was measured for each standard solution and was plotted against the corresponding concentration to obtain the calibration graph. HPLC method. Standard solutions of GT (6.0-15.0 •g ml -•) in the mobile phase, containing 4.3 •g ml- • of testosterone acetate as internal standard, were injected into the chromatograph. The ratios of analyte area to internal standard area were plotted against the corresponding analyte concentrations to obtain the calibration graph. ANALYSES OF COMMERCIAL FORMULATIONS Commercially available creams and hydrophilic gels containing GT and GTP at different concentrations (see Table II) were analyzed. First derivative method. Quantities of 300 mg of commercial sample 3 (1% GT) and 1 g of gels 4 and 5 (1% GTP) were transferred into a separator containing 50 ml of chloroform and extracted with 3 x 15 ml of aqueous hydrochloric acid solution (pH 2.0). The chloroform solution was then adjusted to the volume of 50 ml in a volumetric flask. An aliquot of 10 ml of this solution was extracted with 1 x 10 ml and 3 x 5 ml of 1% ammonium hydroxide solution. The combined ammoniacal extracts were adjusted to the volume of 25 ml in a volumetric flask. The filtered resulting solutions were then analyzed as described under Calibration Graphs (first derivative method), and the GT and GTP content was calculated by comparison with an appropriate standard solution according to the formula Cs(Du/Ds), in which Cs is the concentration, }xg per ml, of GT in the standard solution and Du and Ds are the amplitudes 1D248 in the first derivative UV spectrum of the sample solution and standard solution, respectively. The same sample preparation procedure was applied when the blanks of the cosmetic samples, which contained all the components except GT and GTP, were analyzed. Second derivative method. This method was applied to the analysis of the samples 4 and 5 (hydrogels, 1% GTP content). A 1.0-g quantity of the product was dissolved in chlo- roform and washed three times with a solution of hydrochloric acid in water (pH = 2.0). The chloroform extract was adjusted to the volume of 50 ml in a volumetric flask, and an aliquot of 10 ml of the chloroform solution was evaporated to dryness. The residue was dissolved with 1% methanolic potassium hydroxide, diluted to 25 ml in a volumetric flask. The filtered solution was then subjected to the second derivative method, and the amplitude 2D275. 2 was used to calculate the GTP content in each sample by comparison with the appropriate standard solution, according to the formula Cs(Du/Ds), in which Cs is the concentration, in }xg per ml, of GT in the standard solution and Du and Ds are the amplitude 2D275. 2 in the second derivative UV spectrum of the sample solution and standard solution, respectively. The same sample preparation procedure was applied to the GTP lacking hydrogels. HPLC method. A suitable amount of sample was dissolved in a mixture of chloroform- methanol 1:1 to obtain a solution containing 13 }xg ml- • of GT. An aliquot of 10 ml
Purchased for the exclusive use of nofirst nolast (unknown)
From: SCC Media Library & Resource Center (library.scconline.org)