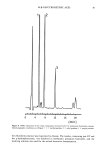
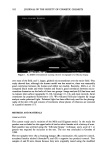
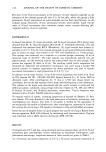
72 JOURNAL OF THE SOCIETY OF COSMETIC CHEMISTS of this solution was evaporated to dryness and the residue suspended with the mobile phase containing 4.3 •xg ml- • of testosterone acetate as an internal standard. The volume was adjusted to 10 ml in a volumetric flask. The resulting solution was filtered and then injected into the chromatograph in triplicate. The unknown samples were run concurrently with a standard, and the peak area ratio of GT to internal standard was used to calculate the GT content according to the formula Cs(Ru/Rs) in which Cs is the concentration, in •xg per ml, of GT in the standard solution and Ru and Rs are the ratios of the peak responses of the GT peak to the internal standard peak obtained from the sample solution and the standard solution, respectively. HPLC IDENTIFICATION OF THE COSMETIC FORMULATION COMPONENTS The sample preparation procedure described under First Derivative Method was applied to all the blanks of the commercial samples, i.e. preparations containing all the ingre- dients, with the exception of the glycyrrhetinic acid. The aqueous acidic extract was directly injected into the chromatograph. Aliquots of the chloroform solutions before and after the extraction with ammonium hydroxide were evaporated to dryness the residue was suspended in acetonitrile:phosphate buffer (0.02 M pH = 3) 60:40 v/v, and the volume adjusted to 10 ml in a volumetric flask. The filtered solutions were then injected into the chromatograph. A 5-ml aliquot of the ammoniacal solutions was acidified with 0.2 ml of 17% phosphoric acid solution in water, diluted to the volume of 10 ml with acetonitrile, and injected into the chromatograph. The components of the analyzed cosmetics (preservatives and antioxidants) were iden- tified through their retention times, by comparison with the pure standards. DETERMINATION OF THE GT CONTENT IN GTP HPLC method. A solution of 28.5 •xg ml- • of GT in the mobile phase, containing 4.3 •g ml- • of testosterone acetate as internal standard, was injected into the chromato- graph in triplicate and run concurrently with a solution containing 120 •xg ml-• of GTP (solvent and concentration of internal standard being the same). The peak area ratios of GTP to internal standard were then calculated and the amount of GT in GTP determined by comparison with the GT standard solution. The GT content in GTP was found to be 34.9%. Spectrophotometric second derivative method. The zero order spectra of a solution of GT (c = 30.7 •xg ml- •) and GTP (c = 74.9 •xg ml- •) in methanolic potassium hydroxide were recorded. The second derivative spectra were then derived, and the GT content in GTP was calculated by comparing the GTP 2D277 value to the GT one (GT in GTP = 34.2%). RESULTS AND DISCUSSION SPECTROPHOTOMETRY The zero-order UV spectra of GT and GTP in neutral medium show the same absorption maximum at 248 nm, which is slightly shifted (to 258 nm) at basic pHs. On the other

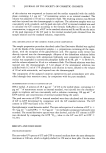
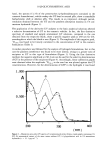
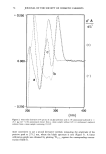
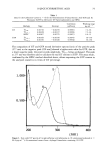
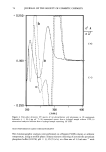
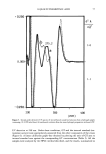
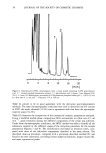
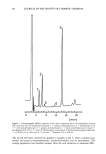
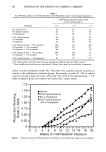
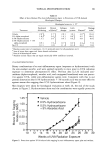
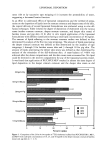
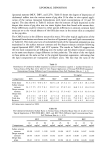
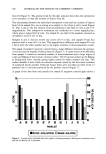
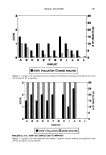
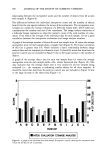
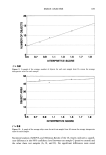
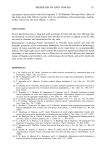
18 I3-GLYCYRRHETINIC ACID 73 hand, the spectra (13,14) of the preservatives (p-hydroxybenzoates contained in the cosmetic formulations), which overlap the GT band at neutral pHs, show a remarkable bathochromic shift at alkaline pHs. This results in an improved, although partial, resolution obtained between the GT and the parabens absorption maxima in 1% am- monium hydroxide (Figure 1). The application of the derivative UV analyses to the basic analytical solutions allowed a selective determination of GT in the cosmetic vehicles. In fact, the first derivative spectrum of standard and sample ammoniacal GT solutions, compared to the one obtained from the respective blank, show a specific negative peak at 248 nm for GT, wavelengths at which the blank is zero (Figure 2). The amplitude of this negative peak, •D248, was found to be linearly correlated to the concentration of GT in the cosmetic formulation (Table I). A similar procedure was followed for the analysis of hydrogels formulations, but in this case the parabens interference was found to be more intense, owing to a greater ratio of excipient to GT in this type of formulation (Figure 3). Using the first derivative method, the negative amplitude at 246.4 nm can be used for the selective determination of GT in the presence of the excipients (Figure 4). Accordingly, linear calibration graphs were obtained when the amplitude 1D246. 4 to the zero line was plotted against the GT concentrations. However, for the determination of GTP in the hydrogels it was found 1.000- c.. 0 500 ' I / : : •.' •l I ß I !"' ' I I I I I I 200 •00 •00 Figure 1. Absorption zero-order UV spectra of: (a) ammoniacal extract from a cream sample containing 1% GT (b) ammoniacal extract of the same cream without GT (c) glycyrrhetinic acid in 1% ammonium hydroxide (c -- 21. ! I•g ml- •).
Purchased for the exclusive use of nofirst nolast (unknown)
From: SCC Media Library & Resource Center (library.scconline.org)