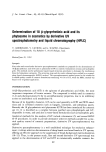
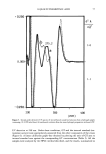
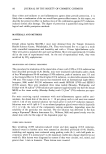
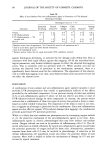
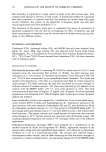
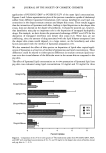
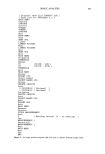
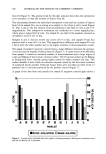
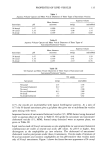
IMAGE ANALYSIS 105 { iO•ig•nal task file COMEDO7.TSK } { Task list for GENIAS25 2.1 } MAIN MENU Capture CAPTURE Correct Change COMEDO CAPTURE Quit MAIN MENU Grey GREY OPS Linear LINEAR FILTERS Mean LINEAR FILTERS Quit GREY OPS Quit MAIN MENU Threshold THRESHOLD Manual 50 {SLICE : LOW } 63 {SLICE : HIGH } THRESHOLD Quit MAIN MENU Binary BINARY OPS Object-based OBJECT-BASED OPS Delete DELETE OBJECTS Area 0.00000E+00 { Minimum? 1.00000E+01 { Maximum? Inc lus ive DELETE OBJECTS Quit OBJECT-BASED OPS Quit BINARY OPS Quit MAIN MENU Measure Objects FIELD MEASUREMENTS Quit 0 { Nesting levels? [0 = no nesting] } Yes MEASUREMENTS 1 Select-all MEASUREMENTS 1 Quit MAIN MENU Quit Yes END Figure 4. Anim•eanalysisprogram (t•klist) used toevaluate •11icularbiopsyslides.

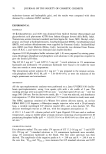
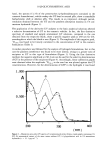
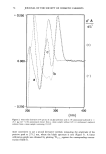
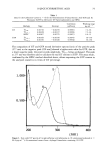
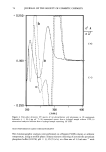
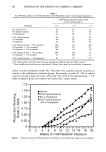
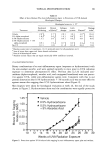
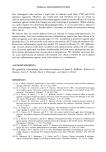
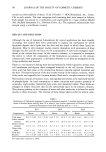
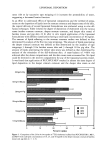
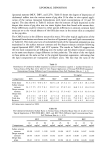
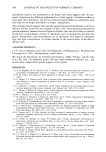
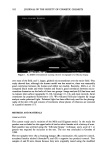
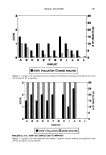
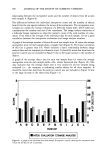
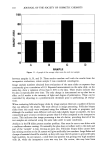
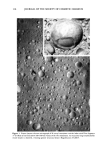
106 JOURNAL OF THE SOCIETY OF COSMETIC CHEMISTS from IA (Figure 5). The general trend for this data indicates that when the interpretive score increases, so does the number of objects from IA. The relationship between the individual interpretive scores and the number of objects from IA for sample B is not as strong as in sample A, but there is still a trend (Figure 6). This is due to the low density of microcomedones in the field of view at the 15 X magnification. The interpretive evaluations are conducted at a lower magnification, which gives a larger field of view. For sample B, one half of the panelists received an interpretive score of 0.5 or less. Samples A and C did not receive any scores of 0.5 or less, and sample D had four panelists with a score of 0.5 or less. This magnification difference with sample B is not a factor with the other samples due to the higher numbers of microcomedones overall. The graph of sample C (positive control) shows a large difference between the interpre- tive scores and the number of objects from IA (Figure 7). A closer review of the FB slides from sample C reveals an increased number of microcomedones and a large degree of scales and flaking of the stratum corneum surface. The IA system picked up the flaking as background noise, thereby giving higher results for object number and area. This surface disorder is most likely an irritation response caused by the four-week occlusion of acetylated lanolin alcohol. Follicular biopsy slides were not taken on three of the 12 panelists due to irritation produced by the positive control (Figure 7). A graph of the data from each panelist for sample D (negative control) again shows a I.iJ o o o o PANELIST INTER. EVALUATION I• IMAGE ANLAYSIS J Figure 5. A graph of the individual data from sample A (cleansing masque), showing the interpretive score and the IA data for all 12 panelists.
Purchased for the exclusive use of nofirst nolast (unknown)
From: SCC Media Library & Resource Center (library.scconline.org)