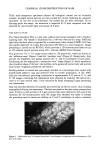
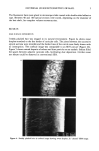
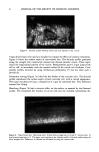
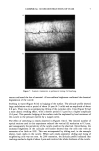
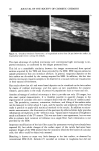
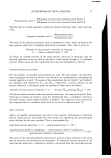
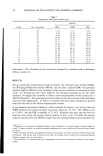
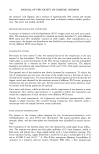
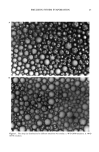
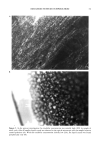
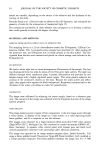
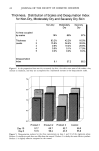
CONFOCAL 3D RECONSTRUCTION OF HAIR 5 The fluorescent hairs were glued to microscope slides coated with double-sided adhesive tape. Between 40 and 100 optical sections were stored, depending on the diameter of the hair shaft, for complete volume reconstruction. RESULTS HAIR SURFACE EXPERIMENTS Freshly plucked hair was imaged in its natural environment. Figure 4a shows sweat droplets attached to the free border of cuticular cells. The joints between the successive optical sections were invisible and the border lines of the cuticle were finely drawn with no interruption. The confocal image was comparable to an SEM picture (Figure 4b). Figure 5 shows natural deposits of sebum and dust particles on an eyelash. Sebum filled the spaces between adjacent cuticular cells, facilitating dust deposition. Neither sweat nor sebum could be observed in conventional SEM. Figure 4. Freshly plucked hair: a) confocal image showing sweat droplets b) "cleaned" SEM image.

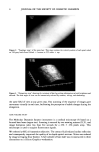
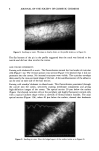
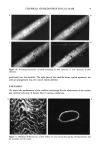
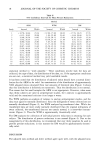
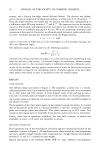
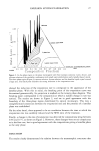
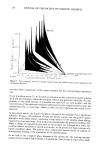
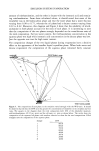
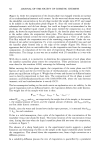
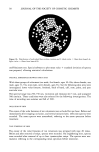
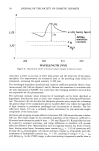
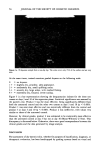
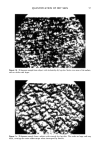
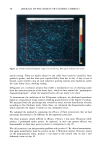
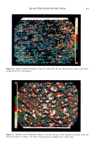
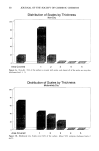
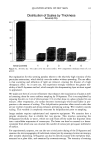
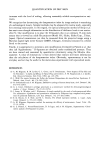
6 JOURNAL OF THE SOCIETY OF COSMETIC CHEMISTS Figure 5. Plucked eyelash showing sebum and dust deposits on the cuticle. Virgin brown hairs were used as a standard to evaluate the effects of cosmetic treatments. Figure 6 shows the surface aspect of non-treated hair. The altitude profile generated along the straight line constructed interactively showed periodic events. These repro- duced the longitudinal pattern of the cuticle. Measurements gave 0.3-1.tm jumps from cell to cell, in accordance with the reputed values (6) for cuticle cell thickness. Com- parable profiles recorded by using mechanical profilometry (7) did not draw such a periodicity. Permanent waving (Figure 7a) lifted the free border of the cuticular cells. The altitude profile reproduced the surface aspect of each cuticular cell, with a curved appearance. The jump was about 0.6 I•m, compared to 0.3 I•m for untreated hair. This difference assessed the lifting. Bleaching (Figure 7b) had a corrosive effect on the surface, as assessed by the flattened profile. The crenelated free borders of cuticle cells and the widened intercellular dis- Figure 6. Virgin brown hair. Horizontal scale: 10 •tm between large bars in X and Y. Vertical scale: 10 •tm between large bars in Z. The upper curve reproduces the altitude profile of the hair surface along the white straight line. Differences in altitude are calculated by using the vertical scale.
Purchased for the exclusive use of nofirst nolast (unknown)
From: SCC Media Library & Resource Center (library.scconline.org)