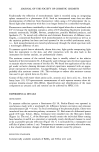
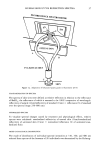
54 JOURNAL OF THE SOCIETY OF COSMETIC CHEMISTS results are variable, depending on the nature of the adhesive and the thickness of the coating on the slide. Recently Serup et al. collected scales on adhesive discs (D-Squames), and estimated the quantity of scales by the attenuation of transmitted light (5). The commercial availability of these adhesive discs prompted us to develop a method that could quantify accurately the degree of scaling. MATERIALS AND METHODS SAMPLING DESQUAMATING HORNY CELLS ON ADHESIVE DISCS The sampling device is a 22-cm clear-adhesive-coated disc (D-Squames, CuDerm Cor- poration, Dallas, TX). Its properties have already been described (5). After peeling off the protective seal, the D-Squames disc is briefly pressed to the skin surface. The disc is peeled from the skin with tweezers and placed on a black storage card included in the D-Squames kit. ILLUMINATION We built a white light box to insure homogeneous illumination of the sample. The box was illuminated from two sides by means of two fiber-optic light carriers. The light was diffused through white translucent glass. Constant illumination was provided by two halogen lamps with a highly regulated power supply. This setup greatly enhances the contrast of the corneocyte clusters on the discs. Because the scales scatter and reflect light, they appear white against the black background. Brightness is proportional to the thickness of the scales, providing an index for quantification. CALIBRATION The lamps were calibrated by adjusting the power supply, based on a reference gray card. The intensity of the image was evaluated with the histogram function of the image analysis program. VIDEO IMAGING The image analysis system consists of four components: 1) the live image source through a video camera, 2) display of the image on a video screen, 3) a video digitizing board frame grabber, and 4) a computer to run the software. The images were obtained by a high-resolution black-and-white CCD video camera (Dage-MTI CCD72, Michigan City, IN) connected to a stereo-microscope (OPMI 1-FC, Zeiss, Germany). A separate video control panel with manual gain and black level controls guaranteed consistent video processing under identical conditions. The image was captured by an image analysis program (Java, Jandel Scientific, CA) using a frame grabber board (Truesvision Targa-M8 Frame Grabber), both installed in a Unisys personal computer. The frame grabber translates the image into 512 X 480

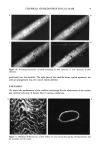
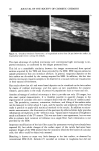
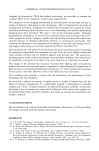
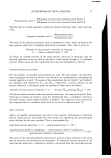
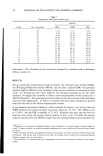
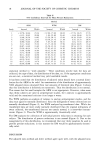
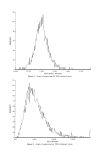
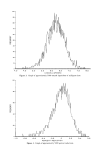
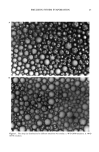
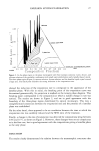
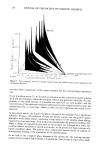
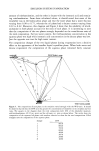
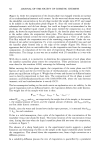
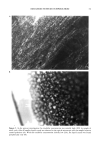
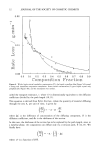
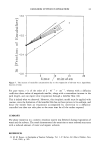
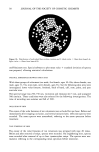
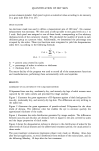
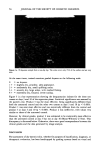
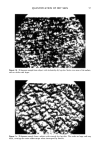
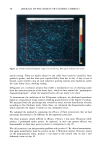
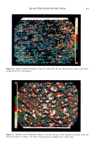
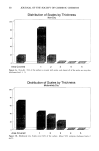
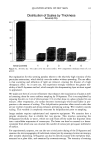
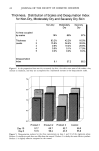
QUANTIFICATION OF DRY SKIN 55 picture elements (pixels). Each pixel is given a numerical value according to its intensity on a gray scale from 0 to 255. IMAGE ANALYSIS An electronic mask was used to define a measurement area of 200 mm 3. No contrast enhancement was necessary. We then used a look-up table to rate gray levels on a 1 to 5 scale. Each pixel was assigned to one of these levels, corresponding to five arbitrary thickness levels of the corneocyte clusters. We calculated the number of pixels in each thickness group as a percent value. Additionally, we determined the percentage area occupied by the scales. These two functions were integrated to yield the desquamation index (D.I.) according to the following formula: 5 2A + Z Tn X (n - 1) n=l D.I. = 6 A = percent area covered by scales. T n = percentage of scales in relation to thickness. n = thickness level (1-5). The macro-facility of the program was used to record all of the measurement functions and transformations, performing these automatically with one keystroke. RESULTS ASSESSMENT OF LEG DRYNESS BY THE D-SQUAMES METHOD D-Squames from non-dry, moderately dry, and severely dry legs of adult women were captured by the video camera and processed by image analysis. Figure I illustrates the gross appearance of D-Squames against a black background for non-dry, moderately dry, and severely dry leg skin. The differences are very striking to the naked eye. Figure 2 illustrates the gross appearance of pseudo-colored D-Squames for the three levels of dryness. The reference color bar enables the eye to estimate quickly the approximate thickness of the scales. Figure 3 illustrates the scale distribution generated by image analysis. The differences between non-dry and dry skin are dramatic both in regard to the area covered by scales and the larger proportion of thick scales. Figure 4 shows the desquamation indexes in relation to the distribution of scales for the three levels of clinical dryness and the abbreviated treatment period the usual period is three weeks. The post-treatment evaluations (regression phase) were made on Monday, three days after the last application, to avoid interference from residues of the moisturizers, and on the following Monday, 10 days after the last treatment.
Purchased for the exclusive use of nofirst nolast (unknown)
From: SCC Media Library & Resource Center (library.scconline.org)