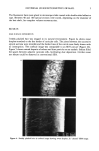
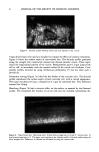
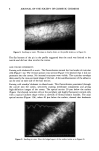
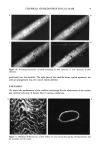
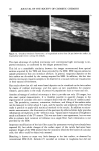
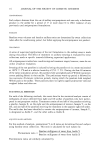
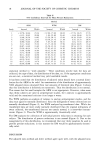
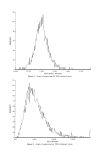
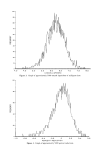
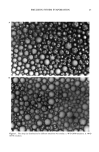
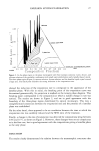
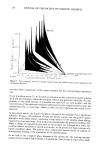
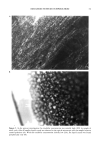
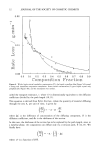
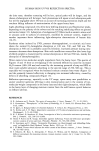
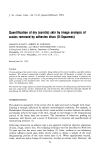
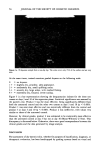
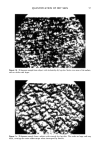
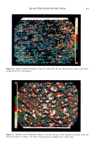
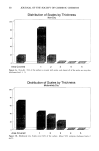
60 JOURNAL OF THE SOCIETY OF COSMETIC CHEMISTS Distribution of Scales by Thickness Non-Dry lOO 80 60 40 20 o Area Covered 1 2 3 4 5 Figure 3a. Non-dry. 16% of the surface is covered with scales, and almost all of the scales are very thin (thickness level = 1). Distribution of Scales by Thickness Moderately Dry lOO 80 60 40 20 o Area Covered 1 2 3 4 5 Figure 3b. Moderately dry. Scales cover 69% of the surface. About 50% comprise thickness levels 2 and 3.

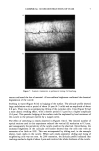
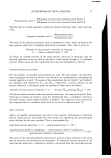
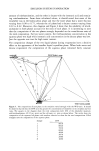
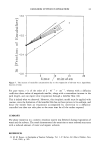
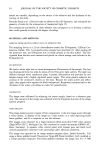
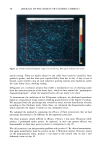
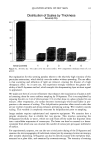
QUANTIFICATION OF DRY SKIN 61 Distribution of Scales by Thickness Severely Dry 100 80 60 40 20 Area Covered 1 2 3 4 5 Figure 3c. Severely dry. The scales cover the entire surface. 85% compromise thickness levels of 2 or greater. Our explanation for this seeming paradox relates to the relatively high viscosity of this particular moisturizer, which thickly coats the surface without spreading. The net effect is that scattering and reflection of light are reduced, creating the illusion of a high therapeutic effect. As it turns out, this experience strongly reinforces the greater reli- ability of the D-Squames method, which samples the desquamating layer without regard to appearance. We make note here of a recent refinement that enhances the visualization of scales as well as loosening them for more uniform sampling by D-Squames. This is accomplished by exposing the skin to 2 ml of ether:acetone (1:1) or ether alone in a glass cylinder for one minute. After evaporation, the surface becomes increasingly whiter and flakier in pro- portion to the amount of scaling. This delipidization procedure often reveals scales that are not evident clinically and always enhances preexisting scaling. Wet weather conceals scaling. This variable is completely overcome by delipidization prior to sampling. Image analysis requires sophisticated and expensive equipment. We mention here a simpler alternative that is reliable but less precise. This involves sonicating the D-Squames forcefully in water, which not only floats off the scales but disperses them into a unicellular suspension of corneocytes. The latter can then be counted in a hemo- cytometer from which one can calculate the number of corneocytes per square millimeter of surface. For experimental purposes, one can also use critical point drying of the D-Squames and examine the microtopography of individual corneocytes by scanning electron microscopy after metallic shadowing. D-Squames can also be directly stained with methylene blue, mounted on a glass slide, and examined by stereomicroscopy. The intensity of staining
Purchased for the exclusive use of nofirst nolast (unknown)
From: SCC Media Library & Resource Center (library.scconline.org)