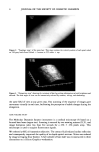
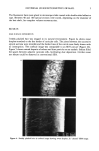
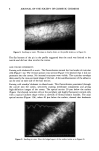
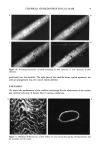
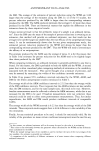
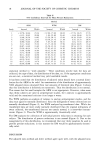
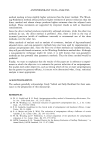
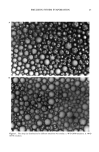
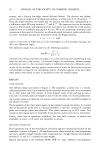
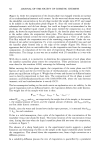
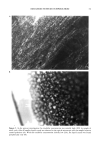
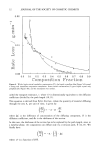
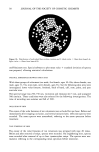
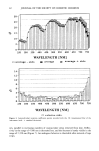
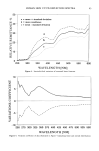
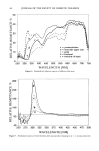
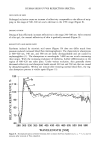
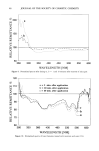
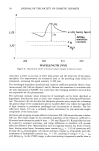
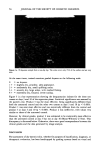
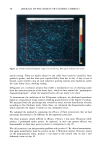
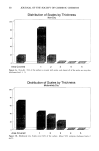
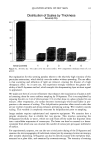
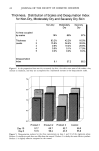
56 JOURNAL OF THE SOCIETY OF COSMETIC CHEMISTS ß w. Figure la. D-Squames sample from a non-dry leg. The scales cover only 15% of the surface and are very thin. At the same times, trained monitors graded dryness on the following scale: 0 = no dryness. 1 + = slightly dry, powdery, ashy appearance. 2 + = moderately dry, small uplifting scales. 3 + = severely dry, large scales, with marked flaking. 4 + = extremely dry, fissured, severe scaling. Figure 5 is a bar representation showing the desquamation indexes for the three test creams at days 3 and 10 of the regression phase. Statistical significance was assessed by the paired t-test. Product 3 was the most effective, being significantly different from both the untreated control and the other two creams at days 3 and 10 (p 0.005). Product 1 was next most effective and was statistically different from the control and product 3 at days 3 and 10 (p 0.005). Product 2 was ineffective, with values very similar to those of the untreated control. However, by clinical grades, product 2 was estimated to be statistically more effective than the untreated control at day 3 but not at day 10 (Mann-Whitney U Test). This discrepancy is discussed below. Otherwise, there was a good correspondence between the clinical grades and the data generated by image analysis. DISCUSSION The assessment of dry (xerotic) skin, whether for purposes of classification, diagnosis, or therapeutic evaluation, has been handicapped by grading systems based on visual and

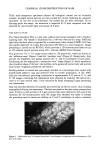
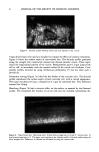
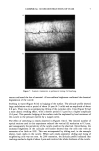
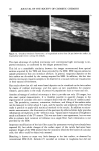
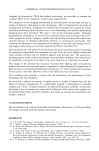
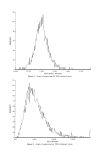
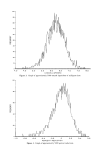
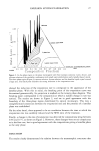
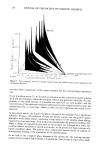
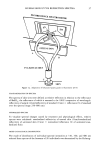
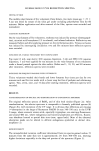
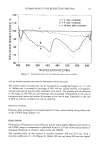
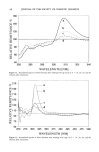
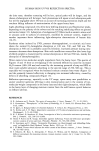
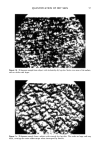
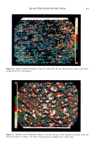
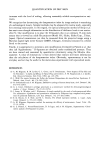
QUANTIFICATION OF DRY SKIN 57 Figure lb. D-Squames sample from subject with moderately dry leg skin. Scales cover most of the surface, and are thicker and larger. • 4, • %•... Figure lc. D-Squames sample from a subject with severely dry leg skin. The scales are large and very thick, covering the entire surface except where interrupted by furrows.
Purchased for the exclusive use of nofirst nolast (unknown)
From: SCC Media Library & Resource Center (library.scconline.org)