214 JOURNAL OF COSMETIC SCIENCE Table III Ingredients Used to Examine the Effect of Carbon Chain Length Carbon chain length Components 14 16 18 Wax ester (unsaturated) Oleyl oleate Oleyl oleate Oleyl oleate Triglyceride (unsaturated) Trimyristolein Tripalmitolein Triolein Fatty acid (unsaturated) Myristoleic acid Palmitoleic acid Oleic acid Wax ester (saturated) Myristyl myristate Palmityl palmirate Stearyl stearate Triglyceride (saturated) Trimyristin Tripalmitin Tristearin Fatty acid (saturated) Myristic acid Palmitic acid Stearic acid rate of 5øC/min from -50øC to 100øC, using a Perkin Elmer DSC-7. Each of the compositions was run in triplicate. For all the individual components, DSC runs were done in pure form and after dissolving in chloroform-methanol and evaporating the solvent. This was done to facilitate identification of the peaks. Polymorphic changes might occur when the individual components are dissolved in the co-solvent mixture, which is consequently evaporated. The above step identifies if any such change occurs. EFFECT OF CARBON CHAIN LENGTH The effect of three different carbon chain lengths (namely 14, 16, and 18) was examined. Major free fatty acids (FFA) of sebum fall in the carbon chain length of 14, 16, and 18 (C-14, C-16, and C-18, respectively) category, with negligible amounts of other carbon chain lengths (10). To investigate the effect of one carbon chain length (14, for example), the triglycerides, fatty acids, and wax esters were all of carbon chain length 14 (see Table III). The same was done for carbon chain lengths 16 and 18 also. According to Table II, the amount of triglycerides is 41%, wax esters are 25%, and fatty acids are 16.4% of the total lipid, and we used approximately that composition for each carbon chain length. The total triglycerides are, however, a mixture of unsaturated and saturated components, and so those were varied also for our second objective. In Table III, we have listed the ingredients used in each experiment. The quantities used are shown in Table IV. EFFECT OF PERCENT SATURATED To study the effect of percent saturated, the carbon chain length of all the components Table IV Sample Compositions With Varying Ratios of Unsaturation to Saturation of Each Lipid Class Components % Weight Unsaturated:saturated 0:1 1:1 2:1 3:1 1:2 1:3 1:0 Squalene 13 13 13 13 13 13 13 Wax ester (unsaturated) 0 13.5 18 20.25 9 6.75 27 Wax ester (saturated) 27 13.5 9 6.75 18 20.25 0 Triglycerides (unsaturated) 0 21.5 28.66 32.25 14.33 10.75 43 Triglycerides (saturated) 43 21.5 14.33 10.75 28.66 32.25 0 Fatty acids (unsaturated) 0 8.5 11.33 12.75 5.66 4.25 17 Fatty acids (saturated) 17 8.5 5.66 4.25 11.33 12.75 0 Total 100 100 100 100 100 100 100

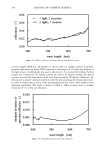
DSC STUDIES OF SEBUM MODELS 215 was kept constant and variation was done in the unsaturated and saturated portions. As an example for the fatty acids, which made up 17% of the total, the ratio of unsaturated to saturated fatty acids was varied, keeping the total to 17% of the mixture, as shown in Table IV. EFFECT OF CHANGE IN TRIGLYCERIDE AND FATTY ACID RATIOS Triglycerides are hydrolyzed to fatty acids by P. aches. The total amount of triglycerides and fatty acids, however, is 60% (10). For these experiments, the carbon chain length was 16 and the ratio of unsaturation to saturation was 1:2, as given by Nordstorm et al. (11). In these experiments only the saturated wax ester (palmityl myristate) was used. The rest of the ingredients were in the same quantities as in Table IV. RESULTS AND DISCUSSION A typical DSC thermogram of model sebum has four distinct transitions that are assigned to different components in the sebum, as shown in Figure 1. Their melting temperature, referred to as Mp-1 through Mp-4, characterizes each of these transitions. While Mp-1 and Mp-2 occur below 0øC and represent the unsaturated portion, Mp-3 and Mp-4 occur above 0øC and represent the saturated portion. From Figure 1, as the temperature is increased from -50øC, a fraction of the lipid mixture melts at approxi- mately -20øC, which is seen as transition Mp-1. As the temperature is increased further, another transition occurs at approximately -15øC, which is designated as Mp-2. As the temperature is further increased, another fraction of the model sebum melts (at about 0.9 0.8 0.7 0.6 0.5 0.4 0.3 0.2 0.1 Mp-1 -2 Mp-4 -50 -25 0 25 50 Temperature (øC) Figure 1. Typical rhermogram of a model sebum. 75 100
Purchased for the exclusive use of nofirst nolast (unknown)
From: SCC Media Library & Resource Center (library.scconline.org)