230 JOURNAL OF COSMETIC SCIENCE in the holding blocks. The skin surface temperature was maintained at 32øC by adjust- ing the circulating water bath temperature to 39øC (11). The effluent from the diffusion cells was collected directly into glass scintillation vials every eight hours for 24 hours. Experiments were conducted in quadruplicate. SKIN TREATMENT At the conclusion of the experiment, the donor compartment was washed three times with 1 ml of acetonitrile. The washes were collected and analyzed by HPLC for the amount of active remaining on the surface. The washed skin samples were removed from the cells. The tape-stripping technique was used to separate the stratum corneum from the rest of the epidermis to get an estimate of material remaining in the barrier layer of the skin. In this technique, seventeen strips of the active-treated side of the skin, using a 3M Scotch TM tape, were taken as two + fifteen strips. The first two strips represented the active superficially adhering to the surface (and so included in the wash), and the next 15 strips represented the active recovered from the stratum corneum. To each of the combined strips, 10 ml of ,-hexane was added exactly. Both these strips were shaken in a wrist-action shaker for 45 minutes, at the end of which the mixture was filtered and injected into the HPLC. The remainder of the skin was placed in plastic culture tubes, 5 ml of ice cold DMPBS was added, and the skin was homogenized (Polytron homogenizer, Switzerland) for five minutes until a buff-colored suspension was obtained. The absence of chunks of skin was ensured. This suspension was extracted three times, each time with 5 ml of ,-hexane. Each extraction involved shaking the mixture on a wrist-action shaker for 45 minutes. After extraction, a 45-minute centrifugation process helped to separate the ,-hexane and DMPBS layers, and the upper ,-hexane layer was carefully removed with a pipette and pooled together into 30-ml glass tubes. This procedure was repeated three times, each time shaking for 45 minutes and centrifuging for 45 minutes for each skin sample. The pooled hexane layer was evaporated under vacuum. Acetonitrile (2 ml) was added to this mixture, vortexed to ensure complete mixing, and the solution was filtered and injected into the HPLC column. Prior experiments were conducted (unpublished observations) to establish the adequacy of hexane extraction for both o•-TAc and o•-T from both strips and pig skin. In both cases greater than 99% recovery of the active was obtained (12). RECEPTOR TREATMENT Receptor solutions were collected in glass scintillation vials every eight hours, and the 3% BSA was precipitated using 4 ml of ACN. The active was extracted into the organic ,-hexane layer (5 ml) by shaking the above mixture for 45 minutes on a wrist-action shaker, followed by a 45-minute centrifugation process. This procedure was repeated two times. Centrifugation was followed by careful removal of the ,-hexane layer into 30-ml glass tubes and evaporation of the organic phase. Acetonitrile (1.5 ml) was added and vortexed to ensure good mixing. A sufficient quantity of this mixture was filtered and injected into the HPLC. Thus, the amount of o•-TAc and its metabolite was estimated in the following four locations in each i, vitro permeation experiment: (a) receptor fluid, (b) washes, (c) stratum corneum (from strippings), and (d) viable tissues of the skin.

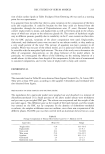
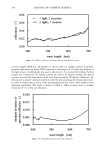
DELIVERY AND METABOLISM OF o•-TAc 231 o•-TAc AND o•-T ANALYSIS For the quantitative determination of o•-TAc and o•-T alone and in the presence of each other, HPLC analysis was used. By means of a Waters 717 autosampler, samples were taken from glass vials and injected into an HPLC apparatus. The latter consisted of a Waters 600 controller connected to a column (3.9 x 300 mm, p Bondapack RP C•s, Waters Corporation) and a variable wavelength detector (Waters 486 tunable absorbance detector) set at 285 nm. Chromatographic data were processed by a Waters 746 data module integrator. With acetonitrile (ACN):water (96:4) as the mobile phase (flow rate 1.4 ml/min), the retention times were 16 minutes for o•-TAc and 13 minutes for o•-T. The detection limits were 0.5 pg/ml (o•-TAc) and 0.25 pg/ml (o•-T). The HPLC method was validated prior to use, using USP standards. Limit of quantification, interday variability, and system suitability had been performed on the system previously. The peak areas were converted into concentrations (pg/ml) using a standard curve developed under conditions of Beer-Lambert's law. These were further converted into micrograms of compound using the dilution factor for each sample. The final results were expressed as percentage of applied dose. STATISTICAL DATA ANALYSES Microsoft Excel (1997) was used to compile and statistically analyze the data. Tukey's studentized range test was used to compare all the formulations to each other. The formulations were also compared to see how they fared against the simple solution. An F-test was done to estimate the interday variability. RESULTS All the formulations were found to be stable at room temperature for the three-week study period, as determined by HPLC. Particle sizes for the microemulsions are given in Table IV. HPLC chromatograms for the viable skin sample for each of the formulations showed two peaks, one at 13 minutes and the other at 16 minutes, identified as o•-T and o•-TAc, respectively, by standard o•-T and o•-TAc. Details of the spiking studies are given in our earlier publication (4). This was the order in which we had expected the peaks to elute, as we had used a reverse-phase HPLC column and o•-T is more polar than o•-TAc. Figure 1 shows the permeation profile for all the formulations in the study. This figure represents the amount of o•-TAc in the stratum corneum, o•-TAc in viable skin, and o•-T in viable skin. No o•-T was detected in the stratum comeurn. The quantities of o•-T and o•-TAc obtained in the receptor were below the limit of detection. The total amount permeated, which is the sum of o•-TAc and o•-T, in viable skin and the stratum corneum is depicted in Figure 2 (dark bars). As compared to the IPM solution, emulsion Table IV Particle Sizes for Microemulsions Formulation Diameter ñ SEM (nm) Emulsion 2 174.6 ñ 3.7 Emulsion 3 67.8 _+ 4.2
Purchased for the exclusive use of nofirst nolast (unknown)
From: SCC Media Library & Resource Center (library.scconline.org)