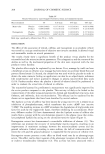
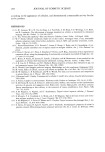
232 JOURNAL OF COSMETIC SCIENCE 25 20 15 10 5 0 [] 5tratum corneum [] alpha-TAc in viable Skin ß alpha-T in viable skin Figure 1. Permeation and metabolism of c•-TAc as a function of formulation. Values are percentage of applied dose, mean _+ SEM (n = 4). Emul 3 Emul 2 Emul 1 Gel 3 Gel 2 Gell lPM-solution 0 10 20 30 40 % Applied dose ß alpha-TAc and alpha-T in total skin [] alpha-TAc and alpha-T in viable skin Figure 2. Total amount oft•-TAc permeated (sum oft•-TAc and t•-T) in viable skin and total skin inclusive of stratum corneum. Values are percentage of applied dose, mean + SEM (n = 4). 2 had higher permeation in the stratum corneum, and this difference was statistically significant (Tukey's, u -- 0.05). Emulsion 2 also had significantly higher permeation as compared to the other biphasic formulations, viz., emulsion 1 and emulsion 3. The formulations were compared with respect to the amount of u-TAc alone in viable skin. All three emulsion systems had significantly higher permeation compared to the IPM solution but did not differ from each other. The gel formulations did not differ from each other either. The amount of metabolite (u-T) formed in the viable skin from emulsion

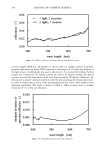
DELIVERY AND METABOLISM OF o•-TAc 233 2 exceeded that of the emulsion 1 formulation. The total amount of c•-TAc permeated was affected by all three terms mentioned above. Emulsion 2 had significantly higher amounts of total permeation than the IPM solution and other emulsions used in this study. The hydroalcoholic gel 3 also had higher total permeation than the alcoholic gel 2. Permeation of ot-TAc in viable skin, which is the sum of both the parent molecule and the metabolite in viable skin is also depicted in Figure 2 (light bars). Emulsion 2 had significantly higher amounts of permeation as compared to the IPM solution. The therapeutic benefit from these formulations can be obtained only by bioconversion of the ot-TAc to ot-T. An important measure of such conversion was thought to be the extent of metabolism (EX). Extent of metabolism (EX, %) has been calculated in the viable skin as shown in equation 1. T Atvs) EX(vs) = T AT^c X 100 (1) A(vs) + ' •(vs) A is the amount of o•-T or o•-TAc as micrograms of active. The subscript (vs) refers to the viable skin. The superscript refers to either o•-T or o•-TAc. The numerator refers to the amount of o•-T in micrograms present in viable skin. The extent of metabolism was found to be formulation-dependent. The IPM-solution, emulsion 2, and the hydroalco- holic gel 3 had a significantly higher extent of metabolism compared to the other formulations. The hydroalcoholic gel 3 was superior to the alcoholic gel 2 in terms of the extent of metabolism. This is depicted in Figure 3. Table V shows the statistical summary of the results for the formulations. Check marks indicate those comparisons for which a statistically significant difference at the 95% confidence interval was found. DISCUSSION We have shown the metabolism of ot-TAc to ot-T in micro-Yucatan pig skin for the first 80_ 70 60 50 40 30 20 10 0 IPM- Gel 1 Gel 2 Gel 3 Emul 1 Emul 2 solution Emul 3 Figure 3. Extent of metabolism of t•-TAc in viable skin. Values are percentage of applied dose mean e SEM (n = 4). *Statistically significant difference (Tukey's test, t• = 0.05) from the unmarked formulations.
Purchased for the exclusive use of nofirst nolast (unknown)
From: SCC Media Library & Resource Center (library.scconline.org)