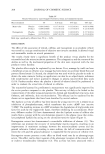
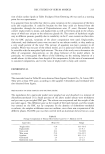
202 JOURNAL OF COSMETIC SCIENCE images representing the zones to be quantified locally in order to multiply information describing the skin. Moreover, a three-dimensional positioning sensor was placed on the sonograph probe in order to be able to associate the images delivered by the sonograph with their positions and their orientation in space. Open3D © technology from I6DP was used. The region of interest (the scanning area) depends on the width of the probe (15 mm) and the motion of the probe during acquisition. We moved the probe for about 20 mm for each acquisition to get a scanned area of 15 mm x 20 mm. Parameters measured were dermal thickness, dermal echogenicity, dermal texture, hypodermal echogenicity, hypodermal texture, hypodermis cellulite ratio, and dermal hypodermal interface. Derreal thick,ess. The value of dermal thickness is the average of the distances measured between the higher contour that materializes the limit of the skin and the lower contour that defines the limit between dermis and hypodermis. The calibration that makes it possible to establish the connection between the pixels of the image and the millimeter is carried out with the assistance of the sonograph: 234 pixels corresponding to 10 mm. Figures 1 and 2 show the results obtained for a sample. Dermal and hypodermal echogenicity. In the average image (Figure lB), the dermis is perfectly identified as being the zone delimited by contours red (a) and blue (b). The value of dermal echogenicity is the average of the values of echogenicity of this area. The hypodermal echogenicity is calculated, in the same way, for the area registered between contours blue (b) and green (c). Dermal and hypodermal texture, Textures of an image can be regarded as particular ar- rangements of items or elementary groupings of items. We conceive this kind of texture as an organized area of pixels. The acoustic signal that builds up the images produces special organized patterns that show similar organization when the region of the body presents a homogeneous structure. These groupings of elementary items present a certain degree of similarity, making it possible to define, for a given texture, a concept of homogeneous area. Thus, the relations of dependence can characterize a texture, which exists between the gray levels of the points of its image. In our case, texture is a parameter describing the capacity of an item for the image to be repeated in the image balanced by the difference of the gray levels that constitute it. Thus, a low value of texture comes from a low contrasted zone without items. On the contrary, a value for high texture expresses items that are repeated with strongly dif- ferent values of echogenicity. The values of texture are calculated for each image in the zones defined by the dermal and the hypodermal contours. Hypodermal cellulite ratio. The ratio of cellulite in the hypodermis is calculated in the original sequence as the ratio of the number of pixels of weak echogenicity, typical of the echogenicity of fat, over the total number of pixels in the hypodermis. Dermal-hypodermal interface. The variations of the interface between dermis and hypo- dermis are underlined by the assistance of the three-dimensional rebuilding function of the I6 3.3 station. An automatic thresholding based on the maximization of the variance is carried out in order to separate dermis from hypodermis as well as possible. This treatment is necessary in order to exclude the possibility of subjective interpretation to separate dermis from hypodermis. The relationship between the developed surface de- scribed by the border between dermis and hypodermis on the analyzed skin surface provides a parameter translating the undulations of the junction between dermis and hypodermis.

ANTI-CELLULITE ACTIVITY 203 b2 •3 Figure 1. Visualization by sonograph of the three layers of the skin (A) Skin slice by B-mode sonography with a 20-MHz probe. (B) Computed image from grabbed images and contours. 3. Mechanical characteristics of the skin: Cutometry Measurements (three measurements on each thigh) were performed with the SEM 575 © cutometer (Courage & Khazaka) on the external part of the thigh (7). The measurements were conducted in an air-conditioned room (22+/-2øC, HR 50+/-10%) after 20 min- utes of rest period. The time-strain mode was used with an elementary load cycle consisting of an instan- taneous deformation by a 500-mbar negative pressure, maintained for three seconds and followed by a three-second relaxation period, with a probe of 6-mm diameter. Three repetitions of this cycle were performed. Suction was applied with a 6-ram diameter probe. Mean Dermal Thickness: 1.86 mm Mean Dermal Echogenicity: 212.91 Dermal Texture: 31.21 Mean Hypodermal Thickness: 9.51mm Mean Hypodermal Echogenicity: 73.36 Hypodermal Texture: 27.87 Hypodermis cellulitic ratio: 7.69% Figure 2. Mean profile of computed image and quantification parameters: Delineation of the different layers allowing calculation of the different parameters.
Purchased for the exclusive use of nofirst nolast (unknown)
From: SCC Media Library & Resource Center (library.scconline.org)