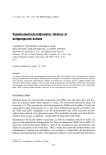
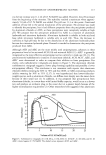
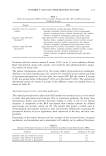
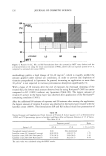
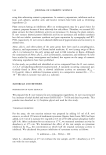
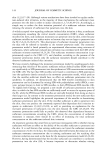
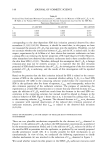
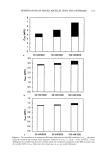
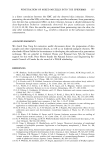
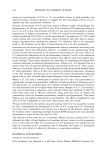
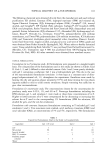
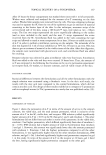
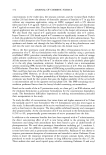
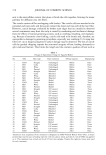
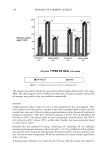
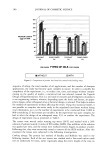
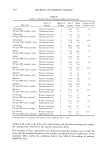
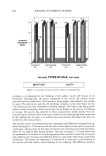
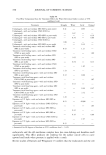
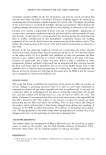
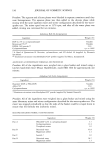
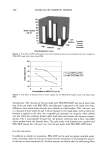
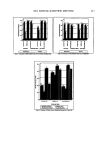
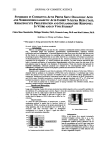
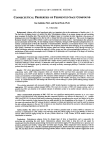
168 JOURNAL OF COSMETIC SCIENCE Figure 1. Effect of formulations on the skin delivery of t•-T. Values are percent applied dose + SEM (n = 4). I, Stratum corneum. B, Viable skin. [], Total amount permeated. l-q, Amount in receptor. Comparison oftx-T and tx-TAcpermeation. Results of ot-T permeation study were compared to ct-TAc permeation studies performed earlier (19). ct-TAc is a commonly used prodrug precursor of ct-T and it has to undergo metabolism by skin enzymes to release the active antioxidant, ot-T. Table IV shows the comparative values for the permeation in viable skin and receptor and total skin and receptor for ct-T and ct-TAc, as a function of the delivery system. ct-T permeation studies showed a lower permeation of active than the ct-TAc studies through all the parameters measured. To find the extent of this decrease, a ratio was taken of the average amount of ot-TAc permeated to the ot-T permeated. The amount of active permeated in viable skin and receptor in the ct-T permeation study was lower by about 2.22 times than the active that permeated from the ot-TAc permeation study. The ct-TAc permeation study had values about 2.98 times higher than the ct-T study when measured as total skin plus receptor, which is inclusive of the stratum corneum. Although the values obtained in studies using either ot-TAc or ot-T were numerically different, certain trends observed in both the studies remained the same. For Table IV Comparison of c•-T and c•-TAc Permeation at 24 Hours Viable skin + receptor (% applied dose) Total skin + receptor (% applied dose) Formulation cz-T cz-TAc cz-TAc/cz-T cz-T cz-TAc cz-TAc/cz-T IPM solution 9.74 + 0.89 15.93 -+ 2.18 1.64 3.17 + 0.49 6.66 + 1.27 2.10 Gel 1 6.47 + 0.54 17.54 + 4.79 2.71 2.24 _+ 0.24 8.73 -+ 3.19 3.89 Gel 2 6.62 _+ 1.26 9.99 + 0.95 1.51 3.16 + 0.88 6.42 _+ 0.26 2.03 Gel 3 8.55 + 0.55 19.69 -+ 2.28 2.30 3.42 + 0.37 9.65 -+ 1.10 2.82 Emulsion 1 6.72 _+ 1.4 16.02 + 4.27 2.38 3.46 _+ 1.22 9.85 -+ 1.98 2.85 Emulsion 2 12.24 _+ 0.98 31.67 + 5.87 2.59 5.83 -+ 0.77 15.22 + 2.27 2.61 Emulsion 3 6.95 + 1.28 16.82 + 4.97 2.42 2.30 _+ 0.32 10.49 _+ 3.10 4.56 Average 2.22 2.98 Values are percent applied dose _+ SEM (n = 4).

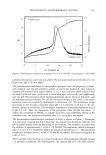
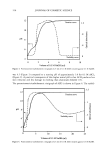
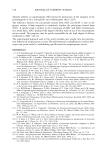
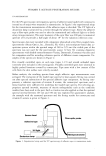
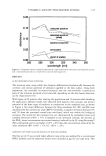
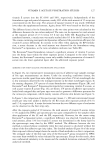
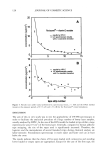
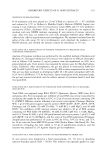
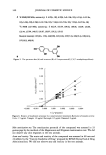
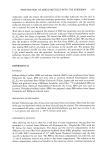
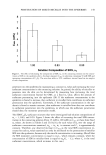
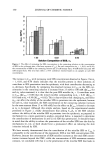
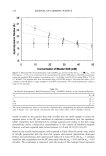
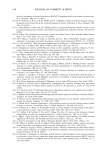
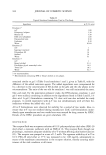
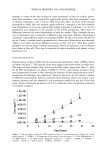
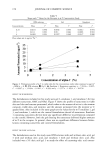
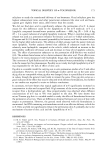
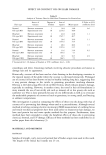
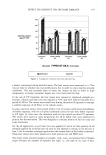
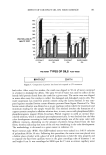
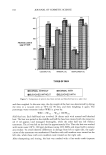
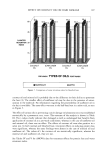
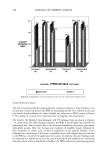
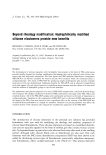
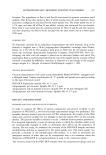
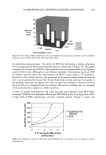
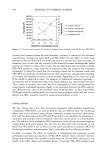
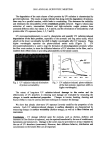
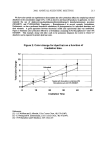
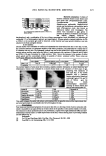
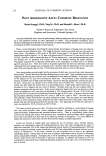
TOPICAL DELIVERY OF ot-TOCOPHEROL 169 example, in terms of the total amount of active permeated in both the studies, perme- ation from emulsion 2 was statistically significantly greater than from emulsions 1 and 3, whereas emulsions 1 and 3 did not differ from each other. In terms of the amount permeated in viable skin and receptor, again emulsion 2 emerged as the best formula- tion. Permeation of active was significantly higher compared to emulsion 3 in the ot-T permeation and compared to the solution in the ot-TAc permeation. There were no differences between the other formulations in both the studies. Thus, although the two sets of experiment were conducted at different times and under different experimental conditions, using different analytical techniques (HPLC for the ot-TAc assay and LSC for the ot-T assay), a similar trend in permeation as a function of formulation was observed. There is very little structural difference between ot-TAc and ot-T. They have similar lipophilicities and are devoid of functional groups, which can dissociate to give different ionic forms at skin pH. They may be expected to behave similarly with respect to skin penetration (7). CONCENTRATION STUDY Representative receptor profiles for the concentration dependency study of IPM solution are shown in Figure 2. The linearity of the plots suggests the achievement of steady state. The slopes of these straight lines, which are the flux values, along with their r 2 values for all three formulations, are shown in Table V. As the concentration increased, there was a proportional increase in flux, showing the existence of dose proportionality for ot-T permeation. Interestingly the permeation values for the active in the stratum corneum at different concentrations showed a deviation from linearity, which was unique to the stratum corneum and not observed in the permeation profiles for the rest of the skin tissue. Figure 3 shows the permeation of ot-T in viable skin when the amount permeated was plotted as pg/cm 2. 1.4E+00 1.2E+00 1.0E+00 8.0E-01 6.0E-01 4.0E-01 2.0E-01 O.OE+00 0 5 10 15 20 25 30 Time (hours) Figure 2. Plot of receptor profiles for IPM solution in the ot-T concentration study. Values are concen- tration (pg/cm -2) + SEM (n = 4). Equations of the straight lines are shown. O, 0.25% IPM solution. [•, 1% IPM solution. /•, 4% IPM solution. Regression equations: y = 0.0033x - 0.0084, r 2 = 0.9899 y = 0.0146x - 0.0242, r 2 = 0.9919 and y = 0.0485x - 0.0946, r 2 = 0.993.
Purchased for the exclusive use of nofirst nolast (unknown)
From: SCC Media Library & Resource Center (library.scconline.org)