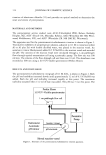
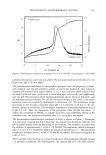
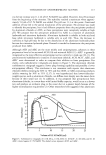
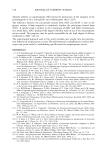
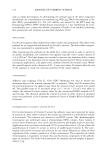
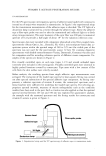
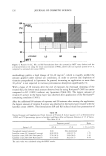
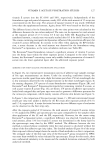
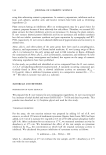
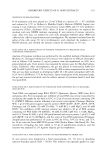
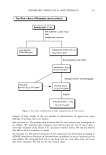
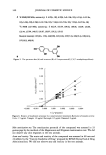
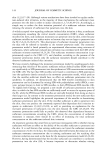
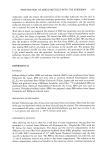
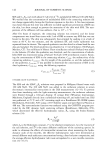
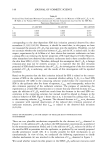
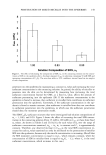
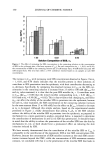
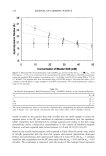
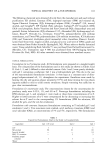
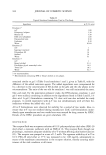
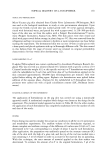
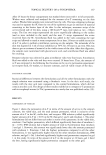
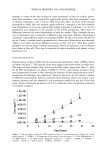
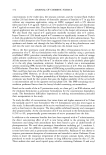
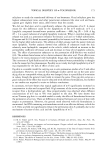
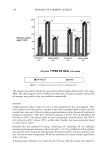
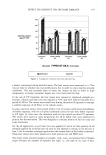
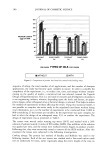
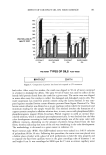
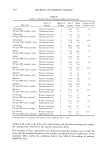
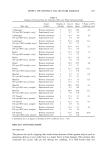
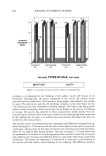
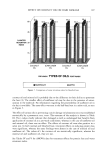
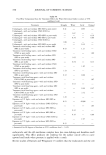
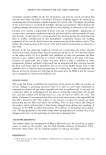
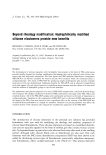
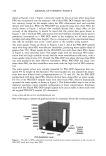
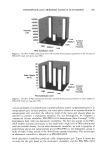
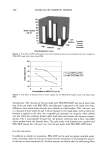
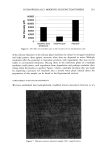
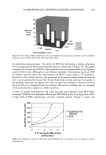
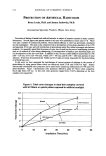
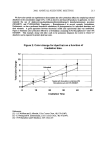
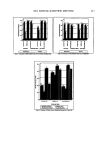
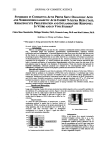
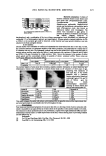
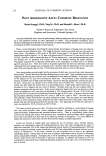
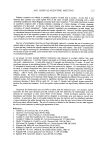
170 JOURNAL OF COSMETIC SCIENCE Table V Slopes and r 2 Values for the Receptor in o•-T Concentration Study IPM solution Gel Emulsion Concentration Flux r 2 Flux r 2 Flux r 2 0.25 0.0033 0.990 0.0041 0.999 0.0012 0.994 1 0.014 0.992 0.011 0.984 0.0065 0.993 4 0.0485 0.993 0.0397 0.960 0.0327 0.980 Flux values are in pg/cm-2hr -1. 35- 30 20 0 1 2 3 4 Concentration ofalpha-T (%) Figure 3. Permeation profile of o•-T in viable skin for the concentration study when expressed as pg/cm 2 + SEM (n = 4). ', IPM solution. l, Gel 3. ', Emulsion 3. Regression equations: y = 7.9944x + 0.0225, 2 = 0.999 and y = 1.3517x + 1.2034, r 2 = 0.8756. r = 0.9997 y = 3.2494x + 0.1042, r 2 EFFECT OF SUNSCREENS The formulations included in this study were gel 3, emulsion 1, and emulsion 3 for two different sunscreens, OMC and OSal. Figure 4 shows the profile of sunscreens in viable skin and the total amount permeated, which refers to the amount of active in the stratum corneum, viable skin, and receptor, and the amount permeated into the receptor as % applied dose. Also included in the same graph are the values for the c•-T emulsion 1, gel 3, and emulsion 3, which are the control formulations devoid of sunscreens. Emulsion 1 containing sunscreens did not show any significant difference in permeation compared to the control. However, both the gels bearing the sunscreens delivered higher amounts of c•-T in the receptor. In general, there was no significant difference between formu- lations containing sunscreens and control formulations. EFFECT OF OLEIC ACID (OA) The formulations used in the study were IPM solution with and without oleic acid, gel 3 with and without oleic acid, and emulsion 1 with and without oleic acid. Also included was a 5% oleic acid gel 3 to study the effect of increasing oleic acid concen-

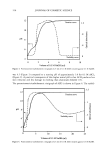
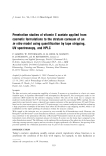
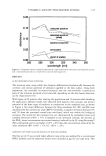
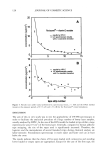
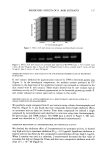
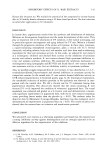
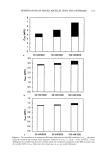
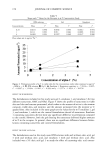
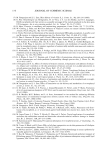
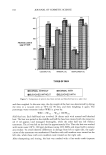
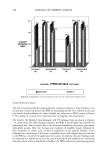
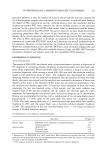
TOPICAL DELIVERY OF o•-TOCOPHEROL 171 25 20 •o 15 5 0 OMC OSal Control OMC gel OSal gel Control OMC OSal Control emulsion emulsion emulsion 3 3 gel 3 emulsion emulsion emulsion 1 1 1 3 3 3 Figure 4. Profiles for sunscreen formulations. Values are percent applied dose + SEM (n = 4). [•, Amount of ot-T in viable skin. [], Amount of ot-T permeated in SC + viable skin + receptor. I, Amount of ot-T permeated in receptor. trations. Figure 5 shows the profile for o•-T permeation in the skin from oleic acid and control formulations. Included are values in the viable skin and receptor and the total amount permeated, which have been described before. Oleic acid formulations were compared to control o•-T formulations using a Student's t-test (o• = 0.05). The 5% oleic acid gel 3 was compared with both the 1% oleic acid gel 3 and with control o•-T gel 3. In each case no statistically significant difference was obtained between the test and control formulation at o• -- 0.05. DISCUSSION This study shows that o•-T can be delivered into viable skin and receptor fluid from various formulations. Topical o•-T treatment results in a significant increase in o•-T 3.5E+01 3.0E+01 2.5E+01 2. 0E+01 1.SE+01 1.0E+01 5.0E+00 0. 0E+00 i i i r r r • OA Control OA gel 3 Control 5% OA OA Control solution solution gel 3 gel 3 emulsion emulsion 1 1 Figure 5. Skin profiles for oleic acid study. Values are percent applied dose e SEM (n = 4). [•, Viable skin + receptor. l, SC + viable skin + receptor.
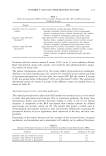
Purchased for the exclusive use of nofirst nolast (unknown)
From: SCC Media Library & Resource Center (library.scconline.org)