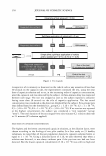
TTC IN PRESERVATIVE EFFICACY TESTING 169 bate ("Tween") 80 (TSAL T) prior to preparation of pure culture saline suspensions containing an estimated 109 CFU / ml. PRESERVATIVE EFFICACY TESTING WITH TTC Separate 50-g test samples were inoculated with 0.1 ml of a saline suspension of each test organism and were mixed. Tenfold serial dilutions were prepared using a multichannel pipetter to add 20 µl to 180 µl of Letheen broth with 1.5% polysorbate 80 (LB) and 0.001 % TTC in successive rows of a 96-well microtiter plate, and the microtiter plate was incubated for 48 h at 30°C. Microbial growth in the enrichment samples was indicated by a change in color from colorless to pink/red. Testing was routinely per- formed at 24 and 168 h (seven days). Where growth for any organism was detected at 24 h and not at 168 h, D-values were calculated using time 0 APCs and 24 h data. If growth was detected at 168 h for a specific test organism, D-values were calculated using time 0, 24, and 168 h data. The reciprocal of the highest dilution showing growth was used to determine the log number of organisms present at each time point, and D-values were calculated as described elsewhere (1). PRESERVATIVE EFFICACY TESTING WITH ALAMAR BLUE The procedure was the same for the inoculation of separate 50-g test samples with 0.1 ml of a suspension of each test organism, mixing and preparing tenfold serial dilutions using a multichannel pipetter to add 20 µl to 180 µl of LB in successive rows of a 96-well microtiter plate. After incubation of the microtiter plates for 48 h at 30°C, 20 µl of Alamar Blue® (Sensititre/ Alamar Trek Diagnostics) was added to each well of the microtiter plate, the plates were incubated for 2 h at 3 5 ° C, and the presence of viable cells was determined by fluorescence measurements with a Cytofluor II Multi-Well Fluorescence Plate Reader (PerSeptive Biosystems Framingham, MA) using excitation at 5 30 nm and emission at 590 nm. Microbial growth in the enrichment samples was indicated by at least a twofold increase in fluorescence intensity over the fluorescence observed in control wells (uninoculated wells with 180 µl LB and 20 µl of Alamar Blue, but no test organisms). The reciprocal of the highest dilution showing growth was used to determine the log number of organisms present at each time point, and D-values were calculated. STATISTICAL TREATMENT OF DATA D-values obtained with TTC were plotted as a function ofD-values obtained on the same samples using Alamar Blue in the miniaturized system. Linear regressions and correla- tion coefficients were determined using Microsoft Excel. Where a test organism was not recovered at a 24 h and the D-value was determined to be "less than" a discrete value (i.e., 4.0 h, 3.3 h, etc.), the "less than" sign was dropped before entering the data points in the scatter plot. RESULTS Table I contains results for the log CFU/ml of S. aureus, P. aeruginosa, B. cepacia, and E.

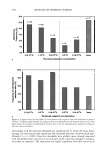
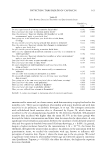
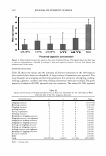
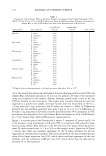
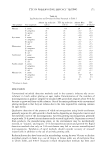
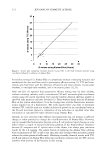
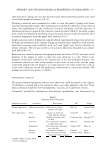
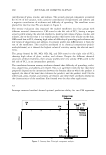
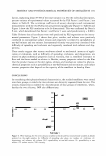
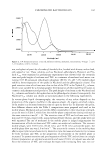
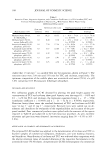
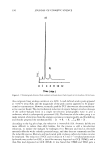
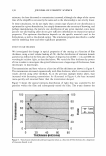
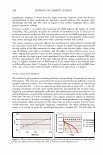
170 JOURNAL OF COSMETIC SCIENCE Table I Comparison of Preservative Efficacy Test Data Without Counting Colonies Using Enrichment of LB With TCC for 48 h at 35°C in 96-Well Microtiter Plates and LB Enrichment Followed by Addition of Alamar Blue to the 96-Well Microtiter Plates and Determination of Fluorescence Test product Mascara Eye cream Moisturizer Conditioner Sunless tanner Mascara tint Test organism S. aureus P. aeruginosa B. cepacia E. coli S. aureus P. aeruginosa B. cepacia E. coli S. aureus P. aeruginosa B. cepacia E. coli S. aureus P. aeruginosa B. cepacia E. coli S. aureus P. aeruginosa B. cepacia E. coli S. aureus P. aeruginosa B. cepacia E. coli Log CPU/ml Alamar Blue (initial) (24 h)* 6.86 6 6.49 0 6.18 0 6.63 0 6.18 2 6.79 0 6.46 0 6.94 0 6.86 0 6.49 0 6.18 0 6.63 0 6.74 0 6.36 0 6.04 0 6.52 0 6.74 0 6.36 0 6.04 0 6.52 0 6.97 6 6.49 3 6.49 2 6.38 4 * Highest dilution showing growth in 96-well microtiter plate after 48 h at 35°C. TTC (24 h)* 6 0 0 0 3 0 0 0 0 0 0 0 0 0 0 0 0 0 0 0 6 3 2 4 coli at the time of inoculation and the highest dilution showing growth in both TTC and Alamar Blue enrichment systems at 24 h in six test products. D-values were calculated using the reciprocal of the highest dilution showing growth (pink color) as the log CFU/ml bacteria at each time point. The results were virtually identical for each test organism in a specific test sample, and most bacteria were not recoverable at 24 h (i.e., 6-log reduction). Log reductions and D-values are shown in Table II. Differences between the two methods generally were only 1-log at 24 h or 1-2 h differences in D-values. Log reductions or D-values could be determined after 48-h incubation in TTC enrichment and after about 50 h with Alamar Blue (enrichment for 48 h in LB followed by 2 h for Alamar Blue addition/fluorescence measurements). Figure 1 is a scatter plot of the D-values for S. aureus, P. aeruginosa, B. cepacia, and E. coli in 44 products using enrichment in LB with TTC as a function of D-values for these bacteria using Alamar Blue addition to the 96-well microtiter plates following enrich- ment. D-values ranged from 3.3 h to 30 h in the samples tested. Inspection of Figure 1 reveals that there was excellent agreement of the D-values obtained for all test organisms in virtually all test samples. Statistical treatment of the data revealed that the slope of the linear regression was 0.98, which shows excellent agreement of the two methods, and the correlation coefficient was 0.98, which shows that the data had an excellent fit to the regression.
Purchased for the exclusive use of nofirst nolast (unknown)
From: SCC Media Library & Resource Center (library.scconline.org)