CHLORINATED BACTERIOSTATS 185 7125 injector equipped with a 250-µl sample loop, and a Model 410 differential re- fractometer (Waters Assoc.). The function of a differential refractometer is to measure the small differences in refractive indices (RI) between a reference solution and a sample solution. A temperature of 39°C, a sensitivity of 4, and a scan factor of 20 were maintained in the refractometer. The difference in RI is referred to as Ll n. The Ll n is measured in 2.5 x 10- 4 RIUFS (RI unit full scale). Chromatograms and peak areas were obtained with a SC-8010 data processing program (Tosoh). Absorbance measurements were on a Cary UV visible spectrophotomer (Varian Australia Pty Ltd.). Nucleosil (250 x 4.6 mm, particle size 5 µm, pore size 10 nm), µBondapack, Hypersil, and a Vydack C18 column were for the separation of the triclosan and TCC. All electrochemical experiments were performed using an EG&G Princeton Research (Princeton, NJ) Model 253 Versatat connected to an EG&G Model 616 rotating electrode system. A three- electrode system was employed, consisting of a working electrode (GCE and M+n/GCE), a platinum counter, and a saturated calomel electrode (SCE) reference electrode. REAGENTS Triclosan and TCC were supplied by TCI (Tokyo Kasei Kogyo Co., Japan) and the McIntyre Group Ltd, respectively. Methanol (HPLC grade) and acetonitrile (HPLC grade) were supplied by Merck (Darmstadt, F.R.G.). Water was prepared from deionized water by an ultra-purification system (Watermaster WD 1106). The other chemicals were of analytical reagent grade. Samples of toothpaste, deodorant, anti-acne washing cleanser, and antibacterial hand and body wash were obtained from a number of retail outlets in the south of Taiwan. PROCEDURES Determination of triclosan and triclocarban (TCC) by LC-RI detector. The triclosan and TCC stock solution were prepared in 100% methanol. Each stock solution was diluted with methanol and water (1: 1, v/v) and mixed thoroughly to produce a working stock stan- dard. Approximately 1 g of the sample was accurately weighed into a 15-ml beaker, 5 ml of methanol was added, and the sample was dissolved by applying gentle heat on the hot plate. Five milliliters of 1: 1 (v/v) acetonitrile:water or methanol:water was added. The solution was centrifuged and transferred into a 10-ml volumetric flask and diluted to volume with methanol. Sample and standard solutions were filtered using 0.45-µm membrane filters before LC analysis. An LC-RI detector was used to determine triclosan and TCC levels. A series SC-8010 liquid chromatograph delivered eluant at a constant 1.5 ml/min rate to a 250 x 4.6 mm reversed-phase column (Nucleosil 5 µm ODS). The eluants were composed of methanol and water containing 0.3 M sodium perchlorate or pH 4.95 acetate buffer (80:20, v/v) or acetonitrile and water containing 0.05 M potassium dihydrogen phosphate, pH 3.05 (70:30, 60:40 and 50:50 v/v). Injection (250 µl) of sample and standard solution were by the injection valve. Quantitation was based on the compound peak area. Determination of triclosan (DP-300) and triclocarban (TCC) by differential pulse voltammetry (DPV). The thin-film metal electrode was produced by the following method: Prior to analysis, the glassy carbon electrode (3-mm diameter) was mirror polished sequentially with an aqueous suspension of 1.0, 0.5, and 0.05 µm alumina. The electrode was rinsed

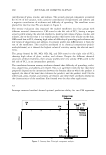
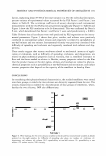
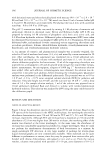
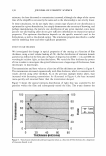
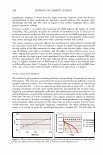
186 JOURNAL OF COSMETIC SCIENCE with deionized water and electrolytically plated with mercury (8.0 x 10⁻⁴ to 2.0 x 10- 3 M) and lead (5.0 x 10- 4 to 2.0 x 10- 3 M) metal ions from 10 ml of acetate buffer (pH 4.5) and 0.1 M perchloric acid, respectively. The plating time was 4 min, with a potential scan from -0.8 to 0.0 V at 1500 rpm. The pH 7.5 ammonium buffer was made by mixing 0.1 M solutions of ammonia and ammonium chloride in deionized water. Briton and Robinson buffer (pH 9.28) was prepared by mixing 0.5 M solutions of phosphoric acid, boric acid, acetic acid, and 0.2 M sodium hydroxide solution. Differential pulse voltammograms (DPV) were taken for chlorinated bacteriostats in a phosphate buffer (pH 2.6), 0.1 M ammonia, Briton and Robinson buffer, and methanol or water containing various supporting electrolytes such as sodium perchlorate, lithium chloride/lithium hydroxide, tetraethylammonium tetra- fluoroborate, and tetrabutylammonium hydroxide solution. A 1-g amount of cosmetic and pharmaceutical samples was accurately weighed, dis- solved in 10 ml of methanol and water (1:1, v/v), and mixed by vortex treatment for 20 min. After centrifuging, the supernatant was transferred into a 10-ml amberized cali- brated flask and made up to volume with methanol and water (1: 1, v/v). In order to obtain calibration graphs for the bacteriostats, 10 ml of the supporting electrolyte was pipetted into a voltammetric cell and de-aerated with nitrogen for 4 min before voltam- metric measurement. By micropipette, aliquots of 1000 mg 1- 1 bacteriostat solution were added. After each addition, voltammograms were obtained the solution was de- aerated for 2 min after each addition, before obtaining the voltammogram. Quantative analyses were performed in the differential pulse mode. The potential was set at 0.0 to 1.0 V and -1.0 to -2.0 V versus saturated calomel electrode (SCE) for oxidation and reduction. The pulse height was 50 mV, and the scan rate was 10 mV s- 1 , with a drop time of 1.0 s. For sample solution analysis, 1 ml of the solution was pipetted into a 10-ml amberized calibrated flask and diluted to volume with tetrabutylammonium hydroxide solution. This solution was analyzed by DPV using the same conditions as for the calibration graph. RESULTS AND DISCUSSION CHOICE OF ANALYTICAL METHOD Figure 2 shows the absorption spectra of triclocarban (TCC) and triclosan. Based on the UV spectra of the bacteriostats in the HPLC mobile phase, the wavelengths selected for absorbance determination were 214 and 260 nm for TCC and 215, 233, and 280 nm for triclosan, respectively. Although TCC and triclosan have a maximum at 215 nm and the absorbance of 233 nm was higher than 280 nm for triclosan, the interfering effect of the matrix was observed at the lower wavelength. At the same time, the absorbance of triclosan was considerably suppressed and shifted to a longer wavelength. Thus we could not perform the simultaneous determination of both bacteriostats in a mixture by single-wavelength UV detection. A very large number of packings for reverse-phase liquid chromatography are now commercially available. These materials can be quite different in performance or nature, since they may be prepared from various silica gels, bonded with diverse chlorosilianes, end-capped or not, and so on. From the various vendors, columns were packed with particles of 5-10 µm, pore diameters of 10-12.5
Purchased for the exclusive use of nofirst nolast (unknown)
From: SCC Media Library & Resource Center (library.scconline.org)