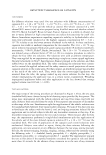
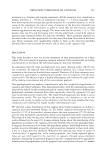
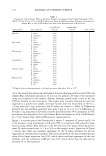
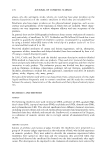
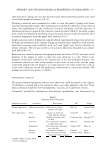
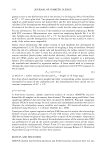
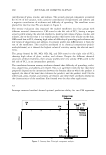
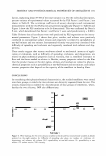
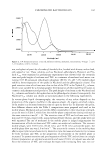
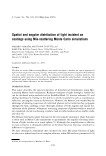
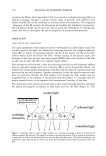
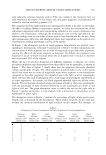
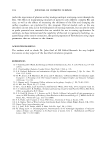
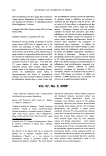
SENSORY AND PHYSICOCHEMICAL PROPERTIES OF EMOLLIENTS 179 nificant (p 0.05), and neither were assessor-repetition, assessor-sample, and repetition- sample interactions. ANOV A showed all parameters (sensory and instrumental) to be significant in discriminating among samples (p 0.001), results that support the validity of the chosen descriptors in developing the sensory profile. INSTRUMENTAL DATA PRINCIPAL COMPONENT ANALYSIS (PCA) In the PCA of the instrumental data for the eight samples, the first two principal components (PC) accounted for 62.6% and 34.4% of the variance, respectively. The first PC (PCl) contrasted surface tension (positively) with spreadability at one-half minute (S0.5) and one minute (Sl) (negatively). The second PC (PC2) was defined negatively by viscosity. The emollient scores for the first two PCs are plotted in Figure 1. Coordinate analysis enabled the discrimination of different groups of emollients accord- ing to the evaluated physicochemical properties. CM scored to the left side of the first PC, showing high values of spreadability at one-half minute and one minute and low values of surface tension. DM scored low in PC2, showing high values of viscosity. A group, including SO, MO, and SQ, scored to the right side of PCl, showing high values of surface tension and spreadability at one-half minute and one minute. The group formed by IPM, DO, and OD showed intermediate properties. The two silicones showed a different behavior. The high viscosity of DM did not result in difficulty of spreading under the action of gravity, as could be predicted, showing similar values of spreadability and surface tension to those of OD or MO. CM showed unique characteristics: its spreadability was approximately twice that of the rest of the emollients. SENSORY DATA PRINCIPAL COMPONENT ANALYSIS The first principal component accounted for 59.7% of the variance, with a positive . �o 1PM ♦ 0.5 ��SQ C_M � ... 2 \0.s -2 -1.5 -1 -0.5 I oo. 0.5 Surface tension S1 -0.5 -1 -1.5 -2 OM • ""' PC 1 Viscosity Figure 1. Instrumental data: Principal component analysis.

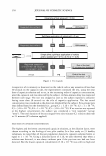
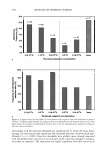
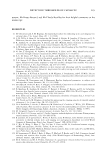
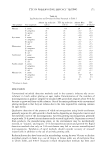
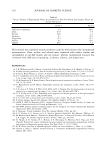
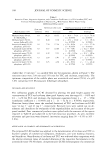
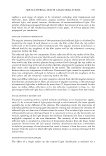
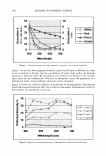
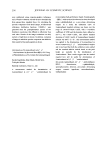
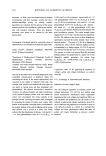
180 JOURNAL OF COSMETIC SCIENCE contribution of gloss, residue, and oiliness. The second principal component accounted for 36.3% of the variance, with a positive contribution of slipperiness and softness and a negative contribution of stickiness and difficulty of spreading. The emollient scores plotted for the first two PCs are shown in Figure 2. The sensory evaluation data separated the studied emollients into four groups with different sensorial characteristics. CM scored to the left side of PCl, having a unique sensory profile among the selected emollients, showing low values of gloss, residue, and oiliness, due to the fact that it is a volatile product that leaves little residue on the skin. DM scored low in PC2, showing high values of difficulty of spreading and stickiness and low values of slipperiness and softness. Its sensory profile also differentiates it from the rest of the emollients. This could be attributed to its chemical composition (polydi- methylsiloxane), as it showed the highest values of viscosity among the selected emol- lients. The group formed by SO, MO, OD, SQ, and DO scored to the right side of PCl, showing high values of gloss, residue, and oiliness. Despite the different chemical structures of these emollients, their sensory profiles were very similar. IPM scored to the left side of PCl, in an intermediate position. The correlation between sensory attributes showed that difficulty of spreading, sticki- ness, slipperiness, and softness are related. This is in agreement with the fact that these properties depend on the interaction between the forearm skin on which the product is applied, the skin of the hand that evaluates the product, and the product itself. On the other hand, gloss, residue, and oiliness are related, and these three attributes depend on the characteristics of the emollient film formed over the skin after application. PLS Leverage-corrected residual showed optimal prediction ability for two PLS regression N 0 Q. .5 CM • -2 Slipperine1& Softness . SQ 0.5 M "� D • 1PM • n DO ♦SO -1.5 -1 -0,5 0.5 Gloss -0.5 Residue Oiliness -1 -1.5 -2 DM .. 5 Difficulty Qt Spreading r"'\.t, I Stickiness Figure 2. Sensory data: Principal component analysis.
Purchased for the exclusive use of nofirst nolast (unknown)
From: SCC Media Library & Resource Center (library.scconline.org)