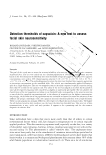
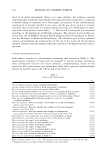
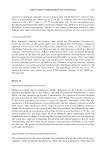
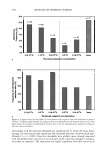
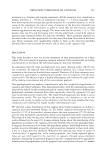
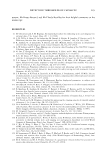
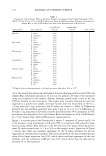
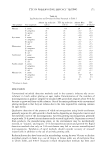
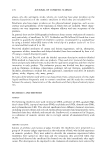
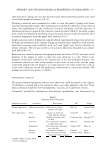
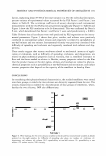
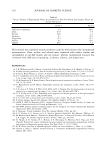
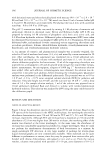
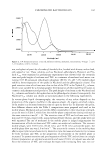
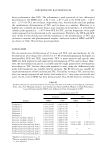
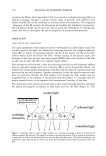
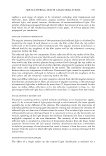
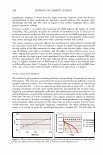
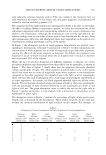
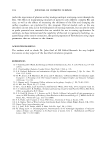
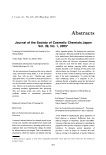
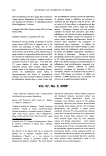
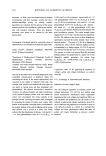
MIE-SCATTERING MONTE CARLO SIMULATIONS 197 Flat ..,,-=---- ·� 4: ·· . -�-, -- 1 -□.8 --------------'"!� :} jo.6 "'0.4 .! 0.2 0 0.2 0.4 0.6 0.8 Parlicle Sze (Microns) 0.2 U4 U6 0.8 Pill1m Size� Sharp # 0-8 +:,,,i,,..,,.,, __ ........ �----.:,, i 0.6 +.,---,.-..;.--�,.,__.........�--,--i 1 OA .:i 0.2 -+,-........ 0 �------..--......,_--"-r-;.;;.._..-j-l_-t;c_:t,----....,.--- 0.2 0.4 06 0-8 Pm:tide Size (lvlcrons) Bias B ----�7 -OB +.-',-'-..,.-.---,,--.....,...-.-.i,---'-- jofl -i,.--. ........ __,,........----'----i;-----i 'l!I 0.4 -i-,;.;,-�---.;...._.----lc,.,--'........'--l _! 02 0 0.2 0.4 0.6 OB Pa-tide Sze [Microns] Wde 1�� f �.il1:ZI 0 I I I 1 02 0.4 0.6 0.8 Partide Size(MCIOOS) U2 0.4 U6 0.8 Pmd!!Slze(Mcmnt Figure 2. Particle size distributions of six hypothetical batches of titanium dioxide dispersed in oil. For all six distributions, the mean particle size is 600 nm and the total amount of titanium dioxide is 2% by volume. 511 48 -+------��--------! 46 +--.,,,..,.--,,--....,-,,c-- 44 -+---- 42---- 40 +--..:..:..:..--'- 311 Exlreme Flat Biase Wde BiasA Shap 100 99 98 97 96 Eldrnrne Flat Biase Wde BiasA ShalJ) Figure 3. Transmission (left) and haze (right) values for six hypothetical batches of titanium dioxide dispersed in oil. The data shown in Figure 3 demonstrate that the distribution of particle sizes in the chosen mixtures affected transmission and haze values tremendously, even though the nominal mean particle size and loading of particles were equivalent. In this study, the spread was over 10 percent for transmission and over 3 percent for haze. These results highlight the importance of knowing the particle size distribution, and not just the mean particle size, of any material that is included in a coating formulation and point to the potential for controlling light-scattering properties through manipulating these parameters. These results further illustrate the effects of agglomeration on optical prop- erties such as transmission and haze and emphasize the importance of particle dispersion in physical systems. The values in Figure 3 are rank-ordered in order of increasing transmission or decreasing reflection in other words, the distributions toward the left of the graph provided higher opacity. Comparing the transmission and haze plots, we see that for these sets of

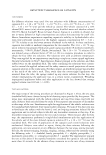
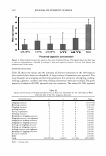
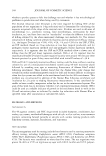
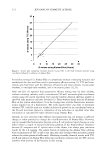
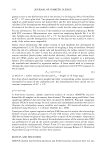
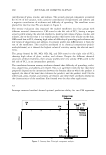
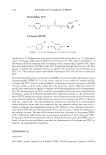
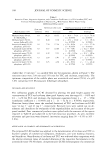
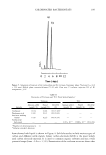
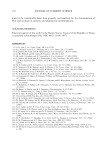
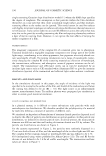
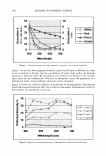
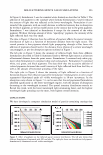
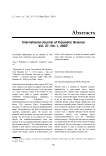
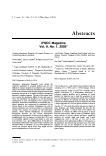
198 JOURNAL OF COSMETIC SCIENCE mixtures, the haze decreased as transmission increased, although the shape of the curves (rate of the dropoff) is not exactly the same and so the relationship is not strictly linear. In these simulations, we do not imply that a certain type of particle size distribution is optimum for a given formulation, but simply demonstrate the necessity of knowing, and perhaps manipulating, the particle size distribution of any given material, since mean particle size and loading alone do not give sufficient information to characterize optical properties. The optimum distribution depends on the specific materials used in the formulation, as well as the desired output. The simulation program described is a useful tool for modeling these and other significant parameters. EFFECT OF FILM THICKNESS We investigated the change in optical properties of the coating as a function of film thickness, using a total volume loading of 2%, the flat distribution of titanium dioxide particles (as defined in the first plot in Figure 2) dispersed in oil (RI = 1 .4), and 600 nm wavelength incident light, as described above. We varied the film thickness by powers of two in order to investigate the optical behavior over a large range of thicknesses, from microscopic to macroscopic. The transmission and haze values as a function of film thickness are shown in Figure 4. The transmission decreased exponentially with film thickness, which is consistent with results derived using other methods. As in the previous example shown above, haze increased with decreasing transmission. As illustrated in Figure 4, the haze increased more quickly and saturated faster than the transmission decayed. Figure 5 shows the spatial intensity distribution of light that was scattered by the particles within the film and subsequently exited the film. The x-axis denotes the C C · ti) ·e ti) C � 100 80 60 40 20 0 0 20 40 60 Thickness (microns) 100 80 60 40 20 0 80 m N � :c -+- Trans: --- Haze Figure 4. Transmission (diamonds) and haze (squares) values as a function of film thickness for a dispersion of titanium dioxide in oil.
Purchased for the exclusive use of nofirst nolast (unknown)
From: SCC Media Library & Resource Center (library.scconline.org)