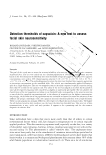
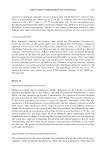
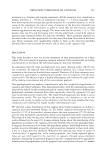
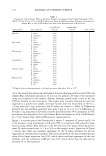
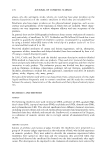
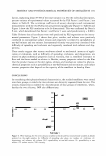
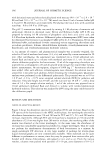
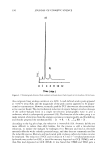
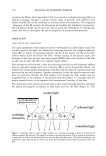
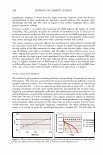
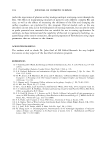
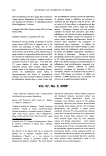
3.0000 2.0000 1.0000 0.0000 220.00 CHLORINATED BACTERIOSTATS 260.00 300.00 Wavelengh ( nm ) 340,00 187 380.00 Figure 2. UV absorption spectra: 1-cm cell reference solution, methanol concentration, 50 mg 1- 1 curve 1, triclocarbon curve 2, triclosan. nm, and spherical particles of octadecyl-bonded silica, bonded with diverse carbon load, end-capped or not. These columns, such as Nucleosil, µBondapack, Hypersil, and Vy- clack C 18 , were examined in preliminary experiments that showed that the retention time and peak height of triclosan and TCC in a mixture of methanol and water con- taining 0.05 M potassium dihydrogen phosphate (80:20, v/v, pH 3.05) mobile phase exhibit a better separation of two peaks in Nucleosil and the µBondapack column. The peak retention time of triclosan was close to that of the TCC in the Vydack C 18 column, which is not suitable for a chromatographic determination of chlorinated bacteriostats in cosmetic and pharmaceutical products. The peak height of triclosan in the Nucleosil and C 18 columns was found to be higher than in the µBondapack column. Consequently, the Nucleosil C 18 column was chosen as stationary phase in the following experiments. In reverse-phase liquid chromatography, the retention of any solute depends on the proportion of the organic modifier in the aqueous eluant. An organic-enriched compo- sition results in a decreased retention time or capacity factor (k). To illustrate this point, four different eluants with the Table I compositions were prepared and used as the mobile phases. Methanol and acetonitrile differ considerably in their eluotropic strength, as can be seen in Table I, which lists the mobile-phase compositions eluting triclosan at the same retention time (k' = 9). The retention time of TCC and triclosan were 10.23 min and 10.53 min, respectively, using methanol/water elution, and the peaks were not well separated The use of methanol in the mobile phase is judged inappropriate for determination of both triclosan and TCC under our analytical conditions. The isocratic mobile phases were 50:50 (v/v), 60:40 (v/v), and 70:30 (v/v) acetonitrile:water the mobile-phase flow rate was 1.0 ml min- 1 . The acetonitrile content in the mobile phase affects capacity factors and sensitivity. Retention time decreases and sensitivity increases for both triclosan and TCC as the proportion of acetonitrile in the mobile phase is increased. To permit retention and good separation of both TCC and triclosan in a single dilutent preparation, an optimal acetonitrile and water (70:30, v/v) eluent was selected. Since the retention of TCC and triclosan decreases with increasing flow rate, we con-

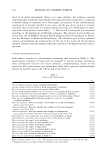
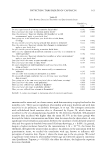
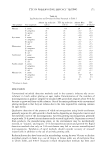
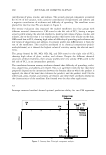
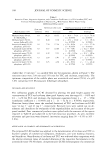
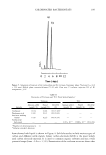
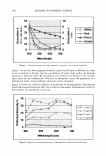
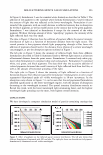
188 JOURNAL OF COSMETIC SCIENCE Table I Retention Times, Regression Equation, and Correlation Coefficients (r) of Triclocarban (TCC) and Triclosan Chromatographed on Nucleosil C 18 With Various Mobile Phases Using Differential Refractometer Retention time (min) Regression equation (0.1 %-0.8%) Flow rate Mobile phases (v/v) (ml/min) TCC Triclosan TCC Triclosan Methanol:water (80:20, 1.0 10.23 10.53 y = -0.47 + 77 .5x y = -1.1 + 76.lx 0.5 M NaClO4) (r = 0.9999) (r = 0.9999) Methanol:water (80:20, 1.0 8.48 9.10 y = -0.31 + 23.9x y = -1.1 + 18.3x acetate buffer pH 4.95) (r = 0.9990) (r = 0.9900) Acetonitrile:water (50:50, 1.0 7.20 17.34 y = 91 + 819x y = -1.6 + 27.2x phosphate, pH 3.05) (r = 0.9999) (r = 0.9999) Acetonitrile:water (60:40, 1.0 5.37 10.09 y = 74 + 768x y = 0.12 + 46.5x phosphate, pH 3.05) (r = 0.9958) (r = 0.9960) Acetonitrile:water (70:30, 1.0 4.49 9.21 y = -28 + 1076x y = 0.47 + 48.3x phosphate, pH 3.05) (r = 0.9900) (r = 0.9999) Acetonitrile:water (70:30, 1.5 2.99 5.81 y = -37 + 950x y = -2.1 + 42.5x phosphate, pH 3.05) (r = 0.9995) (r = 0.9990) Acetonitrile:water (70:30, 2.0 2.23 4.50 y = 48 + 832x y = -1.1 + 40 .4x phosphate, pH 3.05) (r = 0.9950) (r = 0.9999) eluded that 1.5 ml min- 1 is a suitable flow rate for separation, shown in Figure 3. The retention times were 2.99 min and 5.81 min for TCC and triclosan, respectively. The optimum composition of the mobile phase was acetonitrile and water (70:30, v/v, pH 3.05) containing 0.05 M potassium dihydrogen phosphate. PRECISION AND RECOVERY The calibration graphs of LC-RI obtained by plotting the peak height against the concentration of TCC and triclosan show good linearity over the range 0.1 - 0.8% and 0.1 - 1.2% for TCC and triclosan, the regression equations being y = -37 + 950x (correlation coefficient r = 0.9995) and y = -21 + 42.5x (r = 0.9990), respectively. Detection limits (three times the standard deviation) of TCC and triclosan on LC-RI were 34 mg 1- 1 and 23 mg 1- 1 , respectively. Recovery tests were carried out on de- odorants and dentifrices for evaluation of the reproducibility and accuracy of the pro- posed method. Four commercial products were spiked with the amounts of the agents reported in Table II and subjected to the full extraction procedure. As seen, excellent recoveries and precision were observed. (recoveries ranging from 99 ± 0.5% to 105 ± 5.6%). APPLICATION TO COSMETIC AND PHARMACEUTICAL PRODUCTS The proposed LC-RI method was applied to the determination of triclosan and TCC in fourteen samples of commercial toothpastes, deodorants, anti-acne washing cleansers, and dentifrices. Identification of triclosan and TCC was achieved after comparison with the relative retention times of standard dilutions of the respective bacteriostats in the acetonitrile:water (70:30) eluent. A representative LC-RI chromatogram of a commercial
Purchased for the exclusive use of nofirst nolast (unknown)
From: SCC Media Library & Resource Center (library.scconline.org)