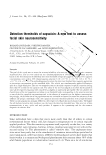
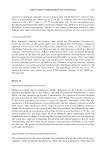
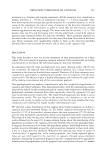
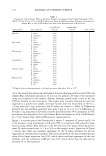
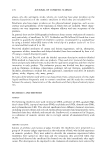
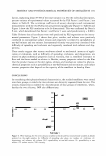
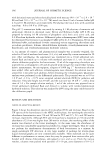
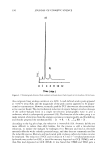
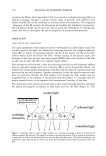
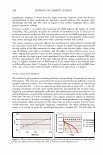
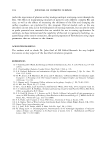
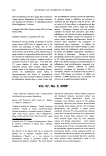
190 JOURNAL OF COSMETIC SCIENCE ..., z ...... a) b) 0 2 4 6 8 10 12 Time ( min) Figure 4. Chromatogram obtained from commercial foam shower bath liquid. (a) triclocarbon. (b) triclosan. this compound may undergo oxidation at a GCE. A well-defined anodic peak appeared at +0.46 V versus SCE, and the magnitude of the peak current appeared to be propor- tional to concentration. However, an anodic peak for TCC that was not electrooxidation- active was not found. The electrochemical reduction of organic halogen involves cleavage of the carbon-halogen bond in a single two-electron polarographic wave to give a carbanion, which is subsequently protonated (29). The function of the ether group is to make removal of electrons from the aromatic system occur more readily, and Stackelberg and Stracke proposed the mechanism RX + 2e - ➔ R - + x- � RH + x-. According to the log plot slope, the reduction is irreversible (30). Aromatic halides are more difficult to reduce than alkyl halides, but the process is still a two-electron reduction, to replace the halogen by hydrogen (31). Mercury and lead as electrode materials offer the wider cathodic potential range, and thus they are commonly used for the reducible species. Mercury and lead-coated gold or glassy carbon electrodes can also be employed. The reduction of TCC and triclosan in 0.1 mol 1- 1 tetrabutylammonium hydroxide was studied on GCE, a thin-film mercury deposited on GCE (TFME), and a thin-film lead deposited on GCE (TFLE). It was found that TFME and TFLE gave a

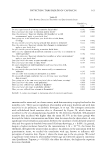
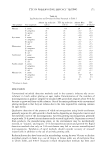
CHLORINATED BACTERIOSTATS 191 better performance than GCE. The voltammetric peak potentials of two chlorinated bacteriostats at the TFME were -1.84 V and -1.85 V and at the TFLE were -1.46 V and -1.55 V for TCC and triclosan, respectively thus, that electrode could not perform the simultaneous determination of TCC and triclosan in a mixture. Moreover, it is highly toxic to handle and may be lead to toxic materials in the products. A well-defined cathodic peak appeared at -1.46 V versus SCE for TCC, and the magnitude of the peak current appeared to be proportional to the concentration. Therefore, the TFLE and GCE were chosen for electroreduction and electroxidation in the determination of TCC and triclosan in cosmetic and pharmaceutical samples. Analytical results of HPLC and DPV are shown in Table III and show good agreement. CONCLUSION The electroreduction dechlorination of triclosan and TCC and electroxidation for the determination of triclosan were achieved in 0.1 M tetrabutylammonium hydroxide on lead-modified GCE and GCE, respectively. DPV is more sensitive and specific than HPLC for both qualitative and quantitative determination of TCC and triclosan. How- ever, the electroreduction process is suitable only for single quantitative determination of triclosan or TCC, because their peak potential is near, using the differential pulse mode. Electroxidation was suitable only for triclosan. The RI detector was suitable for single determination of both triclosan and TCC. The ability to extract TCC and triclosan from one sample preparation and resolve both analytes in 7 min using acetonitrile and water (70:30, v/v) by HPLC has been demonstrated. This LC-RI detection method was Table III Analytical Results for the Determination of Triclosan and TCC in Commercial Toothpastes, Deodorant Sticks, Anti-Acne Washing Cleansers, and Antibacterial Hand and Body Washes by High-Performance Liquid Chromatography (HPLC) and Differential Pulse Voltammetry (DPV) Toothpaste 1 Toothpaste 2 Deodorant 1 Deodorant 2 Deodorant 3 Deodorant 4 Samples Anti-acne washing cleanser 1 Anti-acne washing cleanser 2 Anti-acne washing cleanser 3 Antibacterial hand and body wash 1 Antibacterial hand and body wash 2 Antibacterial hand and body wash 3 Antibacterial hand and body wash 4 Antibacterial hand and body wash 5 a Number of determination (n = 3). 6 Relative standard deviation (RSD). c -, not indicated. Concentration (w/w % t Triclosan HPLC 0.273 (0.6%) 6 0.304 (2.9%) 0.177 (0.6%) 0.194 (0.8%) 0.684 (0.5%) 0.151 (2.2%) 0.277 (1.5%) 0.391(5.5%) 0.213 (2.0%) 0.237 (2.5%) 0.256 (2.6%) 0.195 (3.3%) 0.283 (0.2%) 0.281 (0.2%) DPV 0.305 (5.5%) 0.310 (5.5%) 0.183 (3.7%) 0.204 (5.8%) 0.676(2.1%) 0.155 (5.8%) 0.285 (4.0%) 0.408 (3.3%) 0.228 (2.4%) 0.212 (4.3%) 0.258 (2.2%) 0.206 (1.4%) 0.281 (5.6%) 0.285 (2.8%) TCC HPLC 0.225 (4.3%) 0.303 (1.8%) DPV 0.258 (4.4%) 0.306 (3.1 %)
Purchased for the exclusive use of nofirst nolast (unknown)
From: SCC Media Library & Resource Center (library.scconline.org)