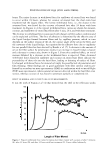
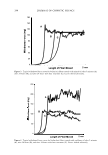
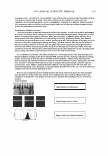
HORMONAL CHANGES AND SKIN 313 day, for a month. Data was organized according to the subject's time of the menstrual cycle and labeled as the day of the month relative to the onset of menstruation, which was day 1. The following measurements were obtained every week for four weeks. Barrier functions and repair. Transepidermal water loss was used as the parameter for barrier integrity (10-12). The test sites were the right and left facial cheek areas. A sticky tape (Tesa Tuck, Tape Systems, Charlotte, NC) was used to cover the test area and, after a firm stroke in both directions, the tape was peeled off (12) three strippings were obtained. Transepidermal water loss (TEWL) measurements were recorded using an EP-1 evaporimeter (Servomed, Sweden) at three sites within the stripped area, pre- and post-stripping. The skin was stripped in increments of three, followed by TEWL mea surements, until a TEWL of 18 g/m2/hr was reached. Damage to the skin barrier is described in terms of the increase in the rate of water loss. The exact number of strippings required to damage the skin barrier (TEWL = 18 g/m2/hr or more) was calculated by plotting TEWL vs the number of strippings and interpolations. Lactic acid sting. As per the protocol of Frosch and Kligman (13), a 10% solution of lactic acid (98% purity, Sigma, San Diego, CA), prepared in phosphate buffer saline, was used for this study. Lactic acid was applied on the nasolabial fold of one side of the face, and saline was applied to the other side. Any adverse reaction (itching, burning, stinging) reported by the subjects was recorded after 2.5 minutes and 5 minutes. The stinging intensity was graded by the subjects as mild, moderate, or severe (scored as 1, 2 or 3, respectively). The sums of the scores at both time points were calculated as the cumu lative intensity of the stinging effect. Moisturization. Skin moisturization was measured via the Nova Meter DPM 9003 (NOVA Technology Corporation, Portsmouth, NH) following the protocols of Tagami (14) and Barel and Clarys (15). Surface electrical capacitance provides a representation of skin surface hydration that is inversely proportional to electrical impedance. The Nova measures an output proportional to the skin's electrical capacitance in the Mhz frequency range. Data acquisition is software-controlled. The higher the skin water content, the higher the output (in arbitary units), and hence, the more moisturized is the skin. Skin surface lipids. Skin surface lipids were evaluated using a sebumeter SM8 l 0 (Courage and Khazaka, Cologne, Germany) as described by Cunliffe et al. (16). Three-hour accu mulation of skin surface lipids was measured. Briefly, three hours after washing the forehead with a mild liquid soap, a translucent plastic strip 0.1-mm thick and with an area of 64 mm2 is applied on the skin and held at constant pressure for a defined time interval, during which sebum absorbs to the strip. The sebumeter measures the increase in the transparency of the strip when it becomes soaked with sebum. The strip is backed by a mirror, which presses it against the skin with a force of l0N by means of a spring. The instrument contains a timing device, which allows for a 30-second measurement. The transparency of the strip is evaluated by means of a microprocessor and is read off a digital instrument directly as gram of sebum per square centimeter. Skin microflora (17-18). Twenty-eight female participants, ages 21-48, were selected for the study based on the criteria described above. The mornings of each visit the subjects washed their face thoroughly with a given mild (anionic, sodium laureth sulfate base) liquid soap and warm water. The subjects were instructed not to wash or even touch their faces for the next three hours. Three-hour bacterial growth was obtained in a saline wash collected from the forehead using a cup-scrub method. A glass cup was held

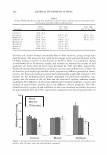
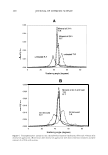
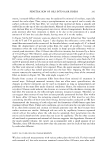
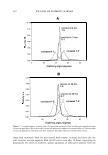
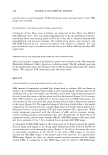
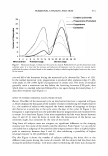
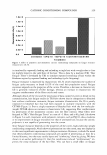
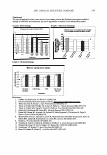
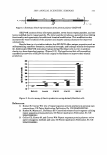
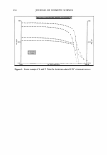
314 JOURNAL OF COSMETIC SCIENCE against the forehead and 1 ml of saline (Dulbecco's phosphate-buffered saline) was poured into the cup. The skin was scrubbed with a rubber policeman (ten strokes) and washed, and then the saline was aspirated and collected in 9 ml of PBS. The sample was analyzed for aerobic bacterial count: One milliliter of sample was diluted into 10-ml tubes of Difco's TAT broth base in order to obtain a 1:10 and 1:100 dilution. Also, 1 ml of sample was plated directly in Trypticase soy agar (TSA) (Fisher Scientific, Pittsburgh, PA) so that the samples containing lower counts of bacteria could be detected. All TSA plates were then incubated for 48 hours at 3 7° C and the colonies counted. The results were expressed as microorganisms per square centimeter of skin. To characterize the bacteria, gram staining was conducted. The grown populations were described by their genus if they appeared to be a certain majority. Plates having more variability in microflora required the use of BBL Crystal Mind software and identifica tion kits (Becton Dickenson Microbiology Systems, Becton Dickenson and Co., Cock eysville, MD) to further characterize some organisms (19). UV effects (20-21). Twenty female participants, ages 21-48, were selected for the study based on the inclusion and exclusion criteria listed above. The source of radiation was a xenon-arc Berger solar simulator (Solar Light Co, Philadelphia, PA) for UV-B irradia tion, using an interference filter with a range of 280 nm to 320 nm and a peak of 300 nm in addition to WG 320 and UG-11 filters. The test site was the backs of the subjects. The minimal erythemal dose (MED) of the subjects was obtained every week for eight weeks. Seven sites (- 2 cm in diameter) were exposed to UV-B in 25% increments, and erythema was visually graded after 24 hours. The minimal energy level (mJ/cm2) to induce a slightly pink erythema after 24 hours is the MED. These MED measurements were obtained every week for two months. During the course of the study, the subjects were instructed to refrain from applying any topical agents to their backs and to totally avoid exposure to the sun. DATA ANALYSIS Data were plotted versus the day in the cycle, considering as day 1 the day of the onset of menstruation. For each person, the day of the cycle was documented at each visit. For every physiological property measured in this study, frequency histograms were plotted, displaying the number of subjects showing the highest (or lowest) score at a particular day of the cycle versus the day of the cycle. RESULTS HORMONAL CHANGES Progesterone and estradiol levels from the blood work were correlated to the time of the month for each panelist. There was a large variability in the levels of estradiol (10--430 RLU, 30--400 picograms/ml) and progesterone (0-700 RLU, 0-2,800 ng/dl), and so the four measurements for each person (per month) were scrutinized and the day of the highest hormone level was recorded and referred to their day of the month. The histo gram of the number of subjects having the highest hormone level at a particular day of the cycle versus the days of the cycle is reported in Figure 1. Figure 1 also displays the
Purchased for the exclusive use of nofirst nolast (unknown)
From: SCC Media Library & Resource Center (library.scconline.org)