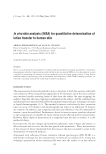
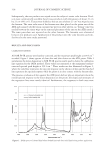
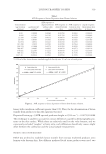
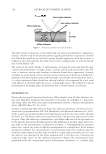
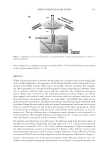
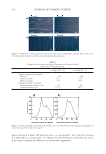
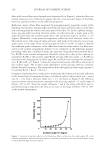
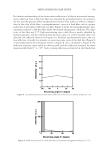
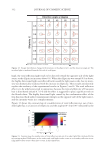
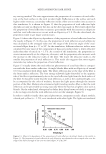
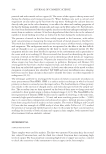
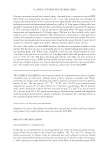
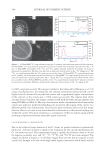
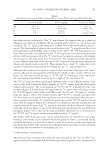
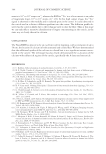
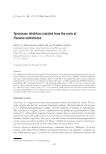
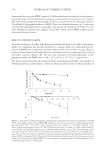
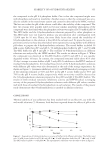
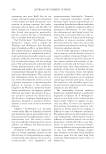
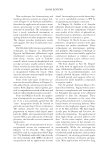
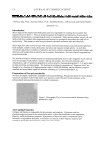
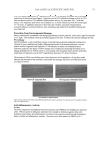
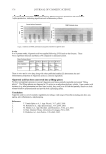
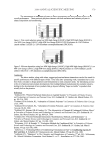
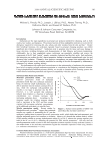
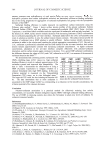
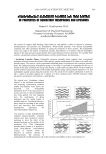
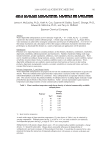
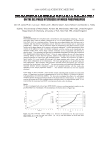
JOURNAL OF COSMETIC SCIENCE 318 Subsequently, the test product was wiped across the subject’s entire volar forearm. Prod- ucts were commercially available facial tissue products with dimensions of about 21 cm by 21 cm (441 cm2). Tissues were folded so that an area of about 25 cm2 was wiped across the forearm. The same volar area of the forearm was then placed on the prism area of the ATR and scanned. (As the lotion contained no water or other solvent, no “drying” time was needed between the tissue wipe on the arm and placement of the arm on the ATR crystal.) The same procedure was repeated on the other forearm. The forearms were alternated between test products used. Application of the product onto the volar forearm used sim- ilar force by the same study personnel. RESULTS AND DISCUSSION CALIBRATION METHOD All ATR FT-IR spectra were baseline corrected, and the maximum peak height at 2914 cm−1 recorded. Figure 1 shows spectra of clean skin and skin+lotion on the ATR prism. Table I summarizes the lotion deposition vs ATR FT-IR spectra results used to derive the calibration line equation for the INSA method. These values are measured at the maximum baseline- corrected spectral peak height at 2914 cm−1. These results are also illustrated in Figure 2, where the solid line represents the spectral response in the absence of skin and the hatched line represents the spectral response while the prism is in close contact with the forearm skin. The presence or absence of skin against the ATR prism did not play an important role in the overall spectral response to the lotion deposition on the prism the slopes and intercepts of the regression lines were nearly identical. Furthermore, the responses in both cases were Figure 1. INSA spectra of cleaned skin before (dashed line) and after (solid line) lotion product application.

LOTION TRANSFER TO SKIN 319 linear, with correlation coeffi cients greater than 0.99. Thus, for the determination of lotion transfer from products to skin this equation was used: Deposited lotion μg = {(ATR spectral peak max height at 2914 cm−1) − 0.0071}/0.0088 This technique is unable to account for contact differences caused by dermatoglyphic pat- terns on the skin surface. While these are relatively small on the volar forearm, and we consciously excluded “rougher” or hairy arms, such differences should only cause a slight offset between the calibration and the actual sample measurement. PRODUCT TESTS ON HUMAN SKIN INSA was utilized to establish lotion transfer from various marketed products onto human volar forearm skin. Five different marketed facial tissue products were used: two Table I ATR Response to Lotion Deposition from Hexane Solution Concentration (μg lotion/g solution) μg lotion/cm2 prism* ATR response to deposited lotion without skin contact ATR response to cleaned forearm skin ATR response to lotion in close contact with skin Δ peak response (skin minus skin & lotion) 0.00 0.0000 -0.0086 0.01050 0.0063 -0.00420 9.666 0.3141 0.0136 0.01350 0.0229 0.00940 11.100 0.3607 0.0031 0.00670 0.0109 0.00420 26.439 0.8593 0.0100 0.00640 0.0182 0.01180 52.094 1.6931 0.0223 0.01030 0.0295 0.01920 101.298 3.2922 0.0556 0.00780 0.0564 0.04860 196.578 6.3888 0.0679 0.00450 0.0699 0.06540 289.487 9.4083 0.0893 0.00620 0.0973 0.09110 376.821 12.2467 0.1224 0.00530 0.1244 0.11910 789.311 25.6526 0.2204 0.01625 0.2176 0.20135 1227.36 39.9022 0.3593 0.00550 0.3555 0.35000 *0.250 ml of the lotion-hexane standards applied directly onto 10 cm2 zinc selenide prism. Figure 2. ATR response to direct deposition of lotion from hexane solution.
Purchased for the exclusive use of nofirst nolast (unknown)
From: SCC Media Library & Resource Center (library.scconline.org)