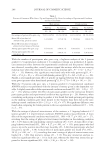
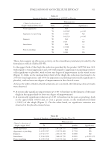
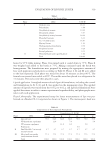
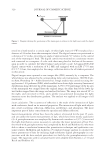
JOURNAL OF COSMETIC SCIENCE 310 was 90° on the surface to be examined, on an area of ca. 2 mm2. The wavelength range was 380–780 nm, corresponding to the visible spectrum. SAFETY The tolerability of the active ingredients visnadine (0.25%), Ginkgo biloba Dimeric Fla- vonoids Phytosome® (0.5%), and escin (1%) (all obtained from Indena S.p.A., Italy), formulated in the fi nished dosage form under the name of ACTIVE (manufactured by Sinerga S.p.A., Italy), was assessed by occlusive patch test prior to the beginning of the effi cacy evaluation. Twenty-three female volunteers, aged 30 to 55 years, used the test product over a period of four weeks, twice daily. In the occlusive patch test, the product was applied in a stan- dardized amount of 20 μl on a Fixomull stretch patch (BSN Medical), and the medium irritation index resulted in 0 at all the considered times (15 min, and 24, 48, and 72 hours from patch removal). Although the trial population was limited to sensitization evaluations, no irritation was observed during the occlusive patch application. RESULTS Twenty-three volunteers completed the study, as two subjects left the trial for personal reasons independent from their participation in the trial at week 2. The clinical evalua- tion (visual appearance and appearance at pinching, fi rmness of inner thigh, skin smooth- ness, and degree of pain at pinching) confi rmed that the active product induced a statistically signifi cant reduction in visual appearance and appearance at pinching in comparison with placebo-induced variations, thus indicating that the “orange peel-like” appearance was found to be less evident at the end of the trial (Tables I, II). Non-signifi - cant results were obtained for the visual score in the placebo-treated area (compared to baseline), apart from the smoothness evaluation, which was found to be statistically signifi cant (p0.001) both in the active and the placebo application versus baseline. Table I Statistical Analysis—Comparison of ACTIVE vs Placebo Clinical evaluations of thigh—upper third Wilcoxon test Time p-value Signifi cance Visual appearance T0 0.3388 NS T4 0.0268* p0.05 Appearance at pinching T0 0.3388 NS T4 0.0017** p0.01 Firmness T0 NA — T4 0.0481* p0.05 Smoothness T0 NA — T4 0.3388 NS Pain at pinching T0 NA — T4 0.1667 NS

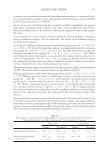
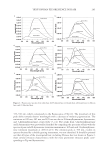
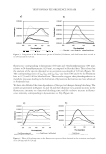
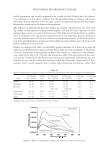
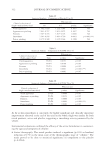
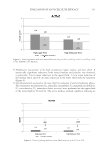
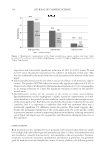
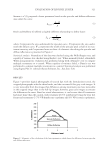
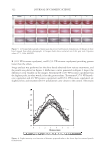
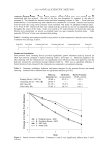
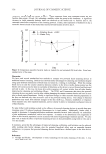
EVALUATION OF ANTI-CELLULITE EFFICACY 311 These data suggest an effi caceous activity on the smoothness parameter provided by the formulation vehicle (Tables III–VI). In the upper third of the thigh the reduction provided by the product ACTIVE was 14% with regard to visual appearance and 21% with regard to appearance at pinching (statisti- cally signifi cant vs placebo), with at least one degree of improvement in the visual scores (Figure 2), while in the median/lower third of the thigh the reduction was found to be 23% for visual appearance and 13% for appearance at pinching (statistically signifi cant vs placebo), with at least one degree of improvement in the clinical scores. As far as the other cellulite-related symptoms are concerned, the following clinical results were observed: A statistically signifi cant improvement ( • p0.05 vs baseline) in the fi rmness of the inner thigh in the upper third (at least one degree of improvement). A statistically signifi cant reduction ( • p0.05 vs baseline) in the pain at pinching, both in the upper third (-82%) and, to even a greater extent, in the median/lower third (-100%) of the thigh (Figure 3). On the other hand, no signifi cant variation was observed in the placebo-treated areas. Table II Statistical Analysis—Comparison of ACTIVE vs Placebo Clinical evaluations of thigh—median/lower third Wilcoxon test Time p-value Signifi cance Visual appearance T0 NA - T4 0.0268* p0.05 Appearance at pinching T0 0.1667 NS T4 0.0151* p0.05 Firmness T0 NA — T4 0.08 NS Smoothness T0 NA — T4 0.3388 NS Pain at pinching T0 NA — T4 0.088 NS Table III Statistical Analysis—Comparison of Placebo T0 to T4 Clinical evaluations of thigh—upper third Wilcoxon test T0 T4 p-value Signifi cance Visual appearance 1.87 ± 0.757 1.87 ± 0.757 1.0000 NS Appearance at pinching 2.43 ± 0.507 2.39 ± 0.499 0.7769 NS Firmness 1.87 ± 0.757 2.00 ± 0.798 0.0880 NS Smoothness 2.30 ± 0.926 3.48 ± 0.790 0.0001 p0.001 (**) Pain at pinching 0.22 ± 0.518 0.13 ± 0.344 0.1667 NS
Purchased for the exclusive use of nofirst nolast (unknown)
From: SCC Media Library & Resource Center (library.scconline.org)