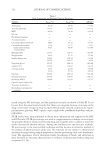
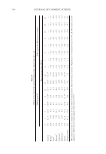
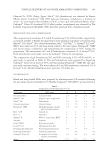
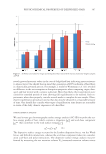
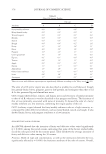
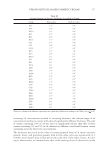
Table II TEWL for the Tested CP and the Ointment Base: Mean Value (N = 22) TEWL (g/m2/h1) TEWL (g/m2/h1) differences vs control Time to action of the CP (h) 0 1 2 3 4 24 25 26 0 1 2 3 4 24 25 26 Control 15.3 11.9 12.8 10.8* 13.6* 12.5 13.6* 11.3* — — — — — — — — Beline ® 10.8 9.3* 9.6 8.8 8.9 8.7 10.1* 9.7* −4.6 −2.6 −3.2 −2.0 −4.7 −3.8 −3.5 −1.7 Ziaja ® 11.1 9.0* 9.3 9.5 9.1 9.4 10.5* 10.4* −4.2 −2.9 −3.5 −1.3 −4.5 −3.1 −3.1 −0.9 Eucerin® 12.9 7.9* 10.1 9.2 9.8 10.0 11.1* 10.3* −2.4 −4.0 −2.7 −1.5 −3.7 −2.5 −2.5 −1.0 Allpresan ® 10.6 8.2* 9.0 9.1 8.9 9.8 9.9* 9.5* −4.7 −3.7 −3.8 −1.7 −4.6 −2.7 −3.8 −1.9 DiabeCare ® 9.5 8.4* 8.4 8.7 8.7 9.4 9.9* 9.4* −5.8 −3.5 −4.4 −2.0 −4.9 −3.1 −3.7 −1.9 Scholl ® 11.3 12.9 11.4 11.5* 11.4* 10.5 11.1* 11.4* −4.0 1.0 −1.4 0.8 −2.1 −2.0 −2.5 0.1 Ointment base 13.2 13.2 11.6 8.4 8.0 9.8 6.9 7.2 −2.1 1.3 −1.2 −2.3 −5.6 −2.8 −6.7 −4.1 The statistical results of comparisons of test products by measurement times have been presented. *Signifi cance (vs ointment base) p ≤ 0.05 all other results are non- signifi cant SD for all the results ranged within limits ± 8.5%. JOURNAL OF COSMETIC SCIENCE 336

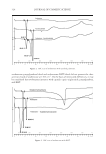
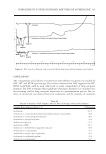
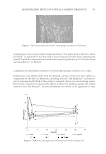
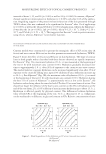
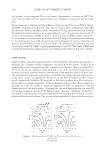
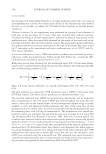
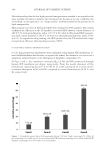
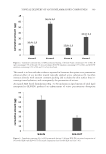
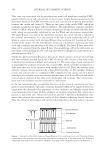
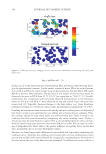
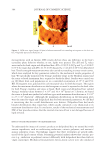
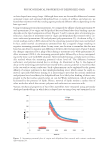
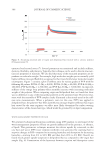
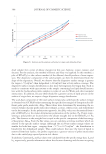
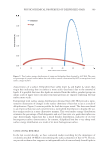
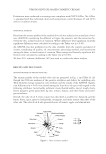
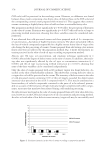
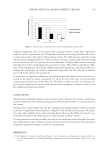
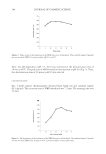
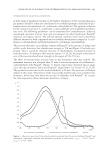
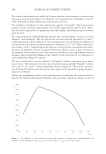
MOISTURIZING EFFECT OF TOPICAL COSMETIC PRODUCTS 337 intervals of hours 1, 25, and 26 ( p 0.02) as well as 24 ( p 0.006). In contrast, Allpresan® showed signifi cant improvement in hydration ( p 0.003) only after 24 h of the applica- tion. Regarding support of the protective barrier function of the skin presented through TEWL values, this was confi rmed to be signifi cant for Eucerin® after 1 h of application ( p 0.005), as well as the 4th and 25th h ( p 0.001) of application, whereas for Allpresan®, it was after the 1st ( p 0.002), 2nd ( p 0.001), 4th ( p 6.23 × 10 −6 ), 24th ( p 2.36 × 10⁻⁸), and 25th h ( p 4.53 × 10⁻⁹). This suggests that Eucerin® tends to possess moistur- izing effects, whereas Allpresan® favors barrier function. THE EFFECT OF PERIOD OF CREAM ACTION AND UREA CONTENT ON THE PARAMETERS OF THE SKIN Contour models were constructed to present the synergistic effect of CP action time (A factor) and urea content (B factor) on the skin parameters monitored (hydration, TEWL). Figure 5 shows the effect of A factor and B factor on skin hydration. The slope of contour lines in both graphs makes clear that both these factors observed are equally important. For Eucerin® (Fig. 5A), maximum hydration (51.6 c.j.) was measured at the beginning of the test (1 h) with maximum urea content (10%). Hydration gradually decreased over time to approximately 1.0 c.j. after 26 h of exposure to the cream at zero urea content. The model, however, suggests hydration can be increased signifi cantly even after 25 h of exposure to the cream by adding urea upon 10% addition of urea, hydration increases up to 16.3 c.j. For Allpresan® (Fig. 5B), the maximum value of hydration (23.0 c.j.) occurred at the beginning of the test (1 h) with maximum urea content (10%). Hydration during the fi rst 15 h of action of Allpresan® is approximately twice as low as for Eucerin®, the hydration values being about the same for both CPs after 20 or more hours of action. One should not forget the infl uence of the foam’s urea content on the effect of hydration at the end of the test (hour 25) a 10% addition of urea increases hydration up to about 15.3 c.j. Hydration is affected greatly by glycerol content. The differences between hydration value of both CPs at the beginning of the test, 51.6 c.j. (Eucerin) vs 23 c.j. (Allpresan), can be attributed to a difference in glycerol content in CPs. Relative concentration of urea Figure 5. Model dependence of skin hydration on CP action time and urea content. (A) Eucerin® (B) Allpresan®
Purchased for the exclusive use of nofirst nolast (unknown)
From: SCC Media Library & Resource Center (library.scconline.org)