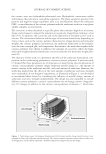
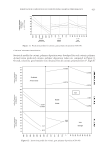
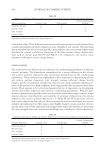
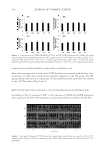
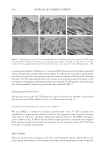
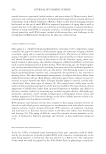
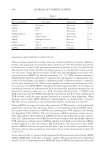
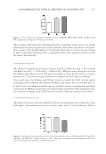
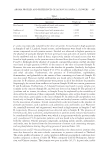
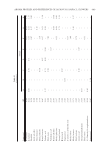
HAIR GROWTH–PROMOTING EFFECT OF L. ESCULENTUM EXTRACT 433 of distilled water were distributed into a glass beaker. A 0.3 g nicotine amide and 0.5 g salicylic acid were added and dissolved, and then the fi nal volume was brought up to 100 ml immediately. The formulations studied were prepared in a PRIMIX RM homomixer (PRIMIX Co., Ltd., Osaka, Japan) at 500 rpm within 5 min and supplemented with 3% (w/w) of LTS. A placebo formulation was prepared without LTS. HISTOLOGICAL ANALYSIS OF HAIR FOLLICLES The substances and test materials were applied topically on the back skin of the mice, once a day for 4 weeks. After week 4, all of the mice were sacrifi ced. Their dorsal skins were removed and fi xed in 4% formaldehyde solution and embedded in paraffi n. The fragments were sectioned into two different patterns: transverse sections for determina- tion of hair follicle count and longitudinal sections for the overall histological assessment. The 3-μm sections were stained with hematoxylin–eosin and toluidine blue and exam- ined under a light microscope (Magnifi cation: ×200) (Olympus, Melville, NY). DRAIZE SKIN IRRITATION TEST The irritation potentials of the test hair tonic solution with 3% LTS were evaluated accord- ing to the method of Draize (26) with slight modifi cation (27). Briefl y, two male New Zealand White (NZW) rabbits weighing 2.5–3.0 kg were acclimatized for 5 days before starting the study. The back of each rabbit was clipped free of hair and then divided into four sectors as shown in Fig. 8: after abrasion and application of hair tonic (upper left), after abrasion and no application of hair tonic (upper right), no abrasion and application of hair tonic (lower left), and no abrasion and no application of hair tonic as NC (lower right). The area of each sector was 6.25 cm2 (2.5 cm ×2.5 cm). For abrasion, several layers of skin were removed with adhesive tape from one half (upper side) of the shaved backs. Adhesive tape stripping was done about fi ve times. A 0.5 ml of the test hair tonic solution with 3% LTS was applied once, uniformly, on the left side only of the hair-free skin of each rabbit. Table I Nucleotide Sequence of the Primers Used For PCR Amplifi cations in This Study Growth Factor Primer Sequence VEGF Forward ACS CGG TGG TGG AAG AAG AG Reverse CAA GTC TCC TGG GGA CAG AA KGF Forward ACG AGG CAA AGT GAA AGG GA Reverse TGC CAC AAT TCC AAC TGC CA IGF-1 Forward TCA TGT CGT CTT CAC ACC TCT TCT Reverse CCA CAC ACG AAC TGA AGA GCA T TGF-β Forward GCG GCA GCT GTA CAT TGA CT Reverse ACT GTG TGT CCA GGC TCC AA GAPDH Forward CAA TGA ATA CGG CTA CAG CAA C Reverse AGG GAG ATG CTC AGT GTT GG

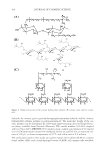
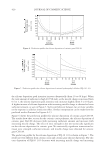
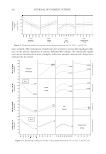
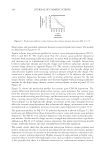
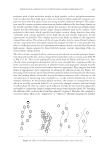
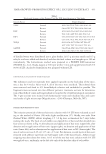
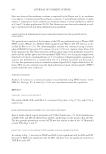
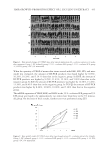
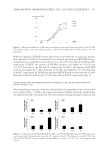
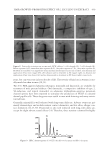
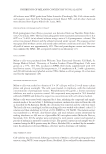
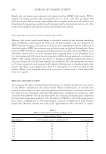
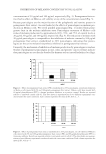
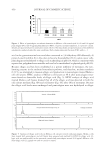
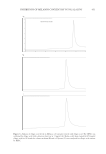
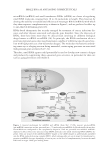
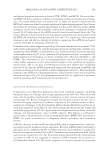
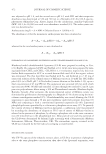
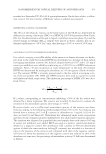
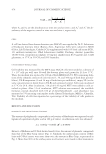
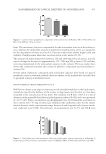
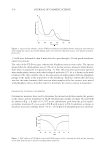
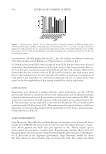
JOURNAL OF COSMETIC SCIENCE 434 Skin was observed for erythema or edema as required by the Draize test (0: no erythema or no edema 1: barely perceptible erythema or edema 2: well-defi ned erythema or slight edema 3: moderate to severe erythema or moderate edema 4: severe erythema or edema) at 24 and 72 h after application (28,29). The Draize test was done and evaluated accord- ing to the Korea Food and Drug Administration guideline. ANALYSIS BY HIGH-PERFORMANCE LIQUID CHROMATOGRAPHY FOR THE QUANTIFICATION OF LYCOPENE The quantifi cation analysis of the lycopene of the LTS was performed using a Waters 600E HPLC system (Waters Co., Milford, MA) equipped with Waters 486 UV detector, as de- scribed by Rho et al. (23). The chromatographic analysis was conducted using a reverse- phase ZORBAX Eclipse plus C18 column (4.6 mm × 250 mm Agilent, Santa Clara, CA) with 5 μm particles. The characterization of the lycopene extracts was performed in isocratic mode and the mobile phase used was methanol/THF (90:10 v/v). Lycopene samples were dissolved in 20 μl of a methanol/hexane (1:2 v/v) solution. Chromatographic separation of extracts was performed at a constant fl ow rate of 1 ml/min. Lycopene was detected at 472 nm. For quantitative analysis, standard lycopene (Sigma L9879 Sigma-Aldrich, Ltd., St. Louis, MO) was also analyzed using the high-performance liquid chromatography (HPLC) system under the same conditions. STATISTICAL ANALYSIS Analysis of variance as a statistical analysis was performed using SPSS (version 12.00 SPSS Inc. Chicago, IL). A value of p 0.05 was considered statistically signifi cant. RESULTS YIELD OF L. ESCULENTUM EXTRACT The yields of EAE, SCE, and LTS of L. esculentum (100 g) were 3.8 g, 0.75 g, and 0.014 g, respectively. HAIR GROWTH–PROMOTING EFFECT OF L. ESCULENTUM EXTRACT After 4 weeks of daily topical treatment on C57BL/6 female mice, 3% (w/w) formulations of EAE, SCE, and LTS all showed hair growth–promoting activity greater than the NC. The hair growth–promoting activity of LTS was also similar to that of the 3% Minoxidil control (PC) (Figs 1 and 2). EFFECT OF L. ESCULENTUM EXTRACT ON THE MRNA LEVEL OF GROWTH FACTORS According to Fig. 3, increases in VEGF and IGF-1 were signifi cant only for SCE and LTS. Increases in KGF were signifi cant only for LTS, and there were no signifi cant increases in TGF-β over the NC.
Purchased for the exclusive use of nofirst nolast (unknown)
From: SCC Media Library & Resource Center (library.scconline.org)