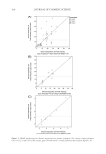
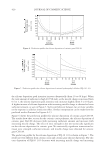
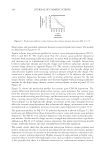
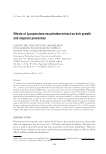
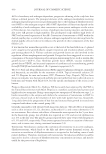
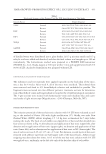
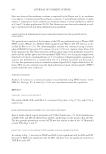
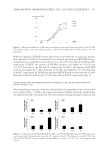
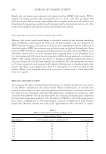
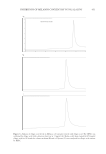
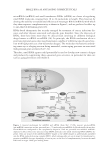
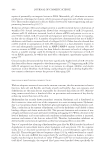
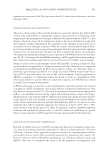
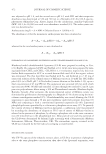
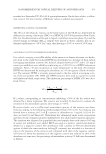
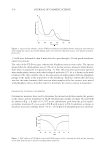
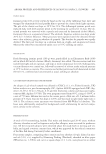
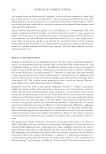
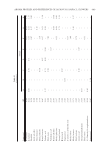
FORMULATION COMPOSITION ON CONDITIONING SHAMPOO PERFORMANCE 419 polymers. In addition, there is a statistically signifi cant interaction between the surfactant amount and the micelle charge. Specifi cally, in the lower left quadrant of Figure 5, the sur- factant amount is on the x axis and the silicone deposition is on the y axis. The two curves represent different levels of micelle charge (0.4395 and 0.957, respectively, as indicated in the fi gure). One curve shows that when the micelle charge is low (i.e., 0.4395), increasing the surfactant amount from 0.02 to 0.07 mol yields a slight decrease in the silicone deposi- tion peak intensity (from 10 to 5 kcps). When the micelle charge is high (0.957), increasing the surfactant amount from 0.02 to 0.07 mol yields a dramatic decrease in the silicone de- position peak intensity (from 60 to 20 kcps). That is, a greater decrease in the silicone de- position with increasing surfactant amount is obtained at high micelle charge. The same interaction is illustrated in the upper right quadrant of Figure 5. In this case, the micelle charge is on the x axis and the silicone deposition on the y axis. The two curves represent two levels of surfactant amounts (0.0188 and 0.0718 mol, respectively). When the total amount of surfactant is low (0.0188 mol), as the micelle charge is increased from 0.5 to 1, Figure 4. Prediction profi ler for silicone deposition of cationic cassia polymers (CC3.0, CC2.3, and CC1.9). Figure 5. Interaction profi les for silicone deposition of cationic cassia polymers (CC3.0, CC2.3, and CC1.9).

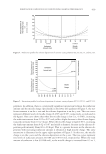
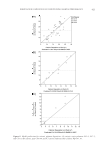
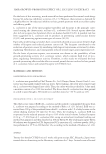
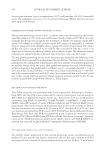
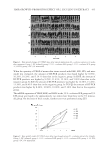
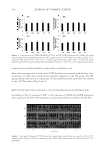
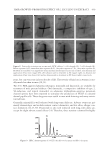
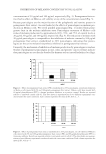
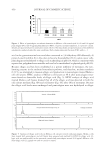
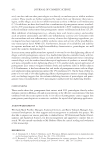
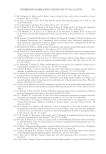
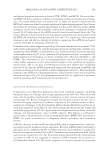
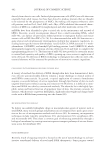
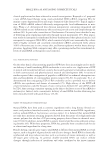
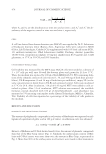
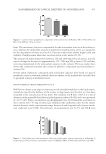
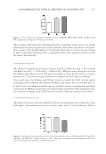
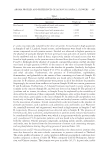
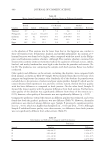
JOURNAL OF COSMETIC SCIENCE 420 Figure 6. Prediction profi ler for silicone deposition of cationic guar CG0.98. Figure 7. Prediction profi ler for silicone deposition of cationic hydroxyethyl cellulose (PQ-10 1.03). the silicone deposition peak intensity increases dramatically (from 10 to 60 kcps). When the total amount of surfactant is high (0.0718 mol), as the micelle charge is increased from 0.5 to 1, the silicone deposition peak intensity only increases slightly (from 5 to 10 kcps). A higher increase of silicone deposition with increasing micelle charge is obtained at lower surfactant amount, as seen in Figure 5. Such joint behavior between two or more variables on the response is called an interaction effect. Similar interpretation can be made from the predicted results illustrated in Figures 6–13. Figure 6 shows the prediction profi ler for silicone deposition of cationic guar CG0.98. The results show that, as seen for the cationic cassia polymers, the silicone deposition of cationic guar CG0.98 decreases with increasing surfactant amount and increases with increasing micelle charge. The effect of ionic strength is also not statistically signifi cant on the silicone deposition for cationic guar. No statistically signifi cant interactions be- tween ionic strength, surfactant amount, and micelle charge were obtained for cationic guar CG0.98. The prediction profi ler for the silicone deposition of PQ-10 1.03 is shown in Figure 7. The results are very different from cationic cassia and cationic guar silicone deposition. The sili- cone deposition of PQ-10 1.03 decreases with increasing micelle charge and increasing
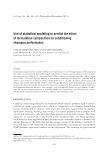
Purchased for the exclusive use of nofirst nolast (unknown)
From: SCC Media Library & Resource Center (library.scconline.org)