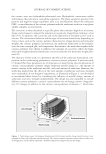
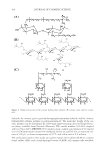
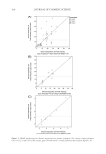
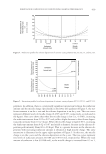
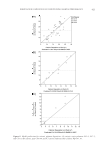
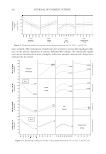
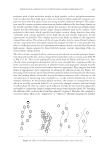
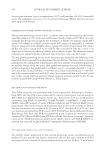
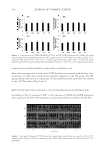
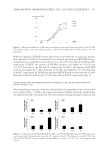
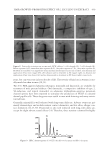
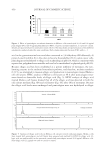
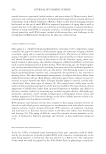
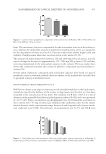
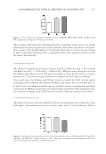
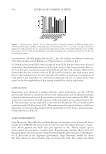
FORMULATION COMPOSITION ON CONDITIONING SHAMPOO PERFORMANCE 417 These parameters can be calculated directly from the amounts of each ingredient in the formulation. The relations are as follows: Total chargedsurfactant amount (mol) Micelle charge Total surfactant amount (mol) , (1) where wt% SLS wt% SLES-2 Total charged surfactant amount 288 381 (2) wt% SLS wt% SLES-2 wt% CAPB Total surfactant amount 288 381 343 . (3) The micelle charge is a mole fra ction the total charged surfactant amount and total sur- factant amount are expressed in moles. The ionic strength is the conductivity (in S/m) of the formulation. It is important to note that the micelles are made up of mixtures of all of the surfactants that are in the shampoo. In fact, it is commonly assumed that the relative amount of each surfactant in a micelle is the same as in the bulk formulation. This means that the average surfactant charge is a convenient measure of the potential that exists on each micelle. Thus, it will be considered to be a theoretical measure of micelle charge density. SILICONE DEPOSITION Statistical models for silicone deposition were developed for each cationic polymer. The graphs of Figure 3 show the correlation between the actual silicone deposition value mea- sured for each formulation by XRF on the y axis and the predicted silicone deposition value derived from the statistical models on the x axis. Overall, relatively good models were obtained for cationic cassia polymers, cationic guar, and cationic hydroxyethyl cel- lulose (PQ-10) [low P, high R2 (Rsq) values, and reasonable agreement between actual and predicted values]. The models are illustrated in Figures 4–7. Figure 4 shows the prediction profi ler for silicone deposition of cationic cassia polymers (CC3.0, CC2.3, and CC1.9). As previously mentioned, the prediction profi ler represents the predicted response as the variables are changed. These profi lers show variables that signifi cantly impact the behavior of the response. The dotted lines on the prediction profi ler represent 95% con- fi dence intervals of the predicted values. Figure 4 shows that the amount of surfactant and the micelle charge are statistically signifi cant factors in the silicone deposition effi ciency of cationic cassia polymers. By increasing the surfactant amount from 0.02 to 0.07 mol, the silicone deposition peak intensity decreases from ca. 25 to 5 kcps. Also, by increasing the micelle charge from 0.5 to 0.9, the silicone peak intensity increases from ca. 5 to 25 kcps. The results show that the silicone deposition of the cationic cassia polymers decreases with increasing surfactant amount and increases with increasing micelle charge. Ionic strength does not have a statistically signifi cant effect on the silicone deposition of cationic cassia

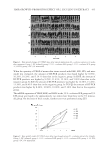
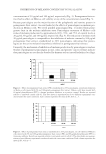
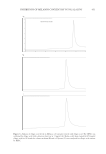
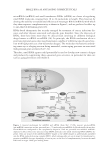
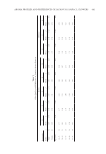
JOURNAL OF COSMETIC SCIENCE 418 Figure 3. Model predictions for silicone deposition for cationic polymers: (A) cationic cassia polymers CC1.0, CC2.3, and CC3.0 (B) cationic guar CG0.98 and (C) cationic hydroxyethyl cellulose PQ-10 1.03.
Purchased for the exclusive use of nofirst nolast (unknown)
From: SCC Media Library & Resource Center (library.scconline.org)