FORMULATION COMPOSITION ON CONDITIONING SHAMPOO PERFORMANCE 415 from Lubrizol Advanced Materials. The dimethicone emulsion [Dow Corning® 2-1352 silicone emulsion (0.5 μm mean particle size)] available from Dow Corning (Midland, MI) was used. The cationic guar and cationic hydroxyethylcellulose poly- mers (PQ-10) are commercial products available from Rhodia (Cranbury, NJ) and Dow Chemical (Midland, MI), respectively. METHODS Hair tress washing procedure. Virgin European brown hair tresses (2.5 g per tress) are pre- washed with an aqueous surfactant solution (10 wt% SLS) and thoroughly rinsed. Two- in-one conditioning shampoos prepared with the formulations of the design of experiments are applied (0.5 g) to each hair tress and gently lathered for 1 min with 40 strokes and subsequently rinsed under fl owing tap water (3.8 l/min) at 37 ± 2°C for 30 s. The tresses are shampooed a second time and rinsed as previously described. After rinsing, the tresses are dried at 23 ± 1°C and 50 ± 5% relative humidity. Cationic polymer deposition on wool. Cationic polymer deposition is measured by using the Direct Red 80 dye colorimetric test (11). The cationic polymer deposition on a virgin wool muslin swatch was measured after two washes, using the washing procedure previ- ously described. Three wool swatches per experimental shampoo are washed twice with 0.25 g of shampoo, immersed into a dilute solution of Direct Red 80 dye for 1 min and rinsed copiously to remove all excess dye. The intensity of red coloring (a*) is measured with a spectrophotometer (Labscan XE, HunterLab, H. F. Scientifi c, Fort Myers, FL). Three readings per wool swatch are recorded. Although this titration method is quite useful, the amount of cationic polymer deposited on the wool substrate and the polymer cationic charge density are confounded in the measure of a*. So comparison of a* values cannot be done among cationic polymers of various cationic charge densities. Silicone deposition measurement. The relative amount of silicone (silicon atoms) deposited on virgin European brown hair tress samples from a two-in-one shampoo composition is measured by X-ray fluorescence (XRF) spectroscopy (12,13). The instrumentation used is a wavelength dispersive XRF spectrometer (Axios Advanced Sequential 4 kW spectrometer, available from PANalytical (The Netherlands), model number PW4400) interfaced with a SuperQ 4 software application and fi tted with a rhodium tube with an InSb crystal used to facilitate high-sensitivity detection of silicon corresponding to the Si K alpha band. The samples are analyzed using a qualitative program to measure intensi- ties across a two-theta scan range from 139.75° to 147.99° with a peak maximum at 144.53°. The samples are scanned in a vacuum environment using a tube voltage of 25 kV and a current of 160 mA. The scanning speed is 0.05°/s. X-rays from the instrument excite silicon atoms deposited on the surface of the hair tress causing them to emit energy and fl uoresce. The silicon fl uore scence is detected and recorded as counts per second. Samples for XRF analysis are prepared by cutting each treated hair tress into 1.5 cm lengths and placing the cut lengths into a sample cup having a 6-μm-thick polyethylene support substrate formed at the bottom. A polyethylene spacer is placed on each cut tress to hold it onto the substrate. Three tresses per formulation are measured. Formulations. Each shampoo formulation contains surfactant levels described in the design of experiments in Table II. The formulations also contain a fi xed amount of cationic poly- mer at 0.25 wt%. The pH is adjusted with citric acid to pH 5.8 in all cases. For silicone

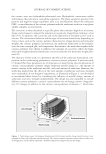
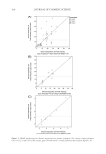
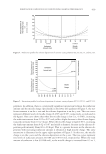
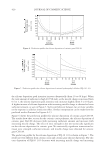
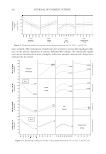
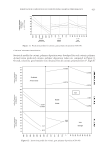
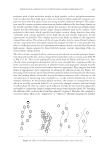
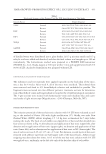
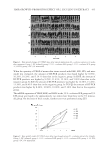
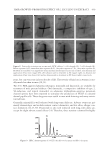
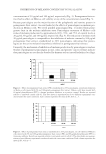
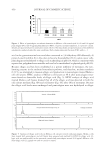
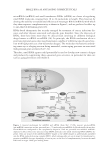
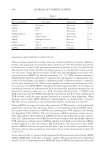
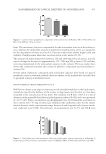
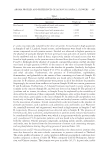
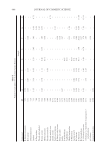
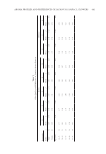
JOURNAL OF COSMETIC SCIENCE 416 deposition, 2 wt% of Dow Corning® 2-1352 silicone emulsion (0.5 μm) is added to the formulation. All wt% values indicated in this study are based on active content. Experimental design. The new design space comprises several curved surfaces as represented by the different symbols shown in Figure 1. Formulations containing various micelle charge, surfactant amount, and ionic strength are derived from points selected from the curved surfaces of the design space. Each symbol represents a possible formulation com- position for the design. The composition of these formulations are converted in terms of commonly used ingredients amounts such as SLES-2, SLS, CAPB, and sodium chloride contents as summarized in Table II. Statistical analysis. The statistical analysis was performed using JMP® 10.0.2 software, available from S.A.S Institute Inc. (Cary, NC). Prediction profi lers and interaction pro- fi les are generated from the statistical models derived from the experimental design. A profi le trace is the predicted response as one variable is changed while the others are held constant at the current values. The prediction profi ler recomputes the profi les and pre- dicted responses (in real time) as you vary the value of an X variable. Prediction profi l- ers are especially useful in multiple-response models to help judge which factor values can optimize a complex set of performance criteria. There are several important points to note when interpreting a prediction profi ler: the importance of a factor can be assessed to some extent by the steepness of the prediction trace. If the model has curvature terms, such as squared terms, then the traces may be curved. If you change a factor’s value, then its prediction trace is not affected, but the prediction traces of all the other factors can change. The Y response line crosses the intersection points of the prediction traces with their current value lines. If there are interaction effects or cross-product ef- fects in the model, the prediction traces can shift their slope and curvature as you change current values of other terms. If there are no interaction effects, the traces only change in height, not in slope or shape. The interaction profi ler brings up interaction plots, which illustrate the joint effects of the factors on the response. Some examples on how to read these graphs can be found in reference 14. RESULTS AND DISCUSSION SURFACTANT BLEND CHARACTERIZATION The surfactant blends can be characterized with simple concepts such as micelle charge, total surfactant amount, and ionic strength. Both micelle charge and the total surfactant amount are important variables to consider in attempting to understand performance. Table II Formulation Compositions Derived from the Design of Experiments Used for All Cationic Polymers Formulation (wt%) 1 2 3 4 5 6 7 8 9 10 11 12 13 14 SLES-2 6 10 6 14 6 6 16 8 6 12 8 6 14 6 SLS 0 8 0 8 0 0 0 6 0 2 8 0 8 8 CAPB 1 6 1 1 3 6 1 1 6 1 6 3 1 1 NaCl 0 0 2 1.5 1 2 2 0.5 0 0.5 2 0 0 2 Cationic polymer 0.25 0.250.25 0.25 0.25 0.25 0.25 0.25 0.25 0.250.25 0.25 0.25 0.25
Purchased for the exclusive use of nofirst nolast (unknown)
From: SCC Media Library & Resource Center (library.scconline.org)