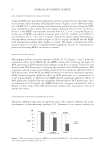
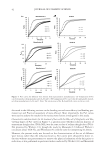
PRACTICAL SELECTING METHOD OF WAVE LOTION FOR HAIR DRESSER 39 DETERMINATION OF THE DISTRIBUTION OF HG (IN FORMED S–HG–S BONDS) IN HAIR To determine the distribution of Hg (in formed S–Hg–S bonds) in the hair fi bers, each treated hair fi ber was embedded in an epoxy resin (EPON812 Taab Co. Ltd., West Berk- shire, UK) and cut into 0.1-μm thick cross sections using an ultramicrotome (Leica EM UC7 Leica Microsystems Ltd., Vienna, Austria). The Hg count (Lα) was measured at 44 points along the diameter of the cross-sectioned fi ber via energy dispersive x-ray (EDX) spectroscopy using a fi eld emission transmission electron microscope (FE-TEM Hitachi HF-2200, Tokyo, Japan) (7) PREPARATION OF SODIUM AND AMMONIUM THIOGLYCOLATE SOLUTION (0.6 M, PH 8.6) Thioglycolic acid (analytical grade reagent Wako Co. Ltd., Tokyo, Japan) was dissolved with water, and pH was adjusted with NaOH/NaHCO3 for sodium thioglycolate and with NH3/NH4CO3 for ammonium thioglycolate. RESULTS AND DISCUSSION EXTENSIONAL PERMANENT SET Linear viscoelasticity about the set in extensional permanent treatment served as the basis for the prediction of the bending set and wave effi cacy. The validity of this approach was confi rmed by the agreement between the observed set values (Sℓ) and the calculated set values (So) obtained using the equation shown below derived by Wortmann (4), which is based on Denby’s linear viscoelasticity theory (8). So = (1 - Ere/Ero) × 100 (%), (5) where Ere is the normalized residual stress after reoxidation (Fre/Fo) and Ero is the nor- malized Young’s modulus after reoxidation (f/Fo). All data derived from the extensional experiments using the wave lotions listed in Table I are presented in Table II. In addition, Figure 4 shows a graph of the calculated values (So) plotted vs. the observed set (Sℓ) values taken from Table II. The experiments were per- formed under two conditions. In the fi rst group (Exp No. 1–9 in Table II), all wave lotions listed in Table I were applied for a reducing time of 14–19 min. In the second group (Exp No. 10–18 in Table II), only the neutral strength wave lotion from manufacturer A (A–N) was applied for various reducing times (1–12 min). The plots shown in Figure 4 pass through the origin and closely follow a straight line with a slope of 1.00, correlation factor r = 0.997. These results therefore indicate that the hair fi bers exhibited linear viscoelastic behavior about the set. Jeong (9) reported similar results for wool fi bers. However, Wortmann obtained very different results under his experimental conditions, which while being similar to those used in the present study, were different in three im- portant aspects, as described in the Experimental section. Specifi cally, Wortmann re- ported that the observed set values (Sℓ) were much smaller than the calculated values (So) (4). However, the reasons for the difference in values remain unclear at this time and further experiments are required to be conducted to verify the reason for this difference.

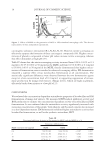
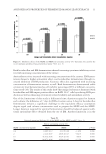
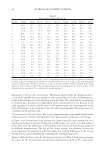
JOURNAL OF COSMETIC SCIENCE 40 Homogeneity of the hair fi ber microstructure. Wortmann reported that the disagreement be- tween the So and Sℓ values was signifi cant and assumed that it was due to inhomogeneity of the radial distribution of the modulus in the hair fi ber. He confi rmed this assumption by performing a bending test independent of the extensional test (10). Because of the good agreement of the So and Sℓ values in the present study, the inhomogeneity of the radial distribution of the modulus in the hair fi bers as proposed by Wortmann were not considered in the present study. Characterization of the wave lotions. The set of a permanent wave is governed mainly by the reduction process, which is determined by the characteristics of the given wave lotion. In Japan, wave lotions have been qualitatively characterized by their strength in wave molding of the hair: S (strong), N (neutral), and W (weak). As a result, it is impossible to objectively assess the differences in the holding characteristics of wave lotions produced by different manufacturers. The use of Pa/t curves resolves this problem, because the curves illustrate the progress of reduction with time, and the differences in the various waving lotions can be identifi ed by comparing the corresponding curves. Figure 5 shows the Pa/t curves for the wave lotions listed in Table I, with parts presenting the curves for the waving lotions produced by manufacturers A, B, and C, respectively. Table II Extensional Permanent Waving Set Exp No Sample t (min) Pa (%) Ere (%) Ero (%) ℓ(mm) ℓ(m) Sm(%) So(%) 1 A–S 16.7 90.5 3.8 58.2 69.0 65.7 95.2 93.5 2 A–N 15.2 79.9 15.5 79.1 67.5 54.8 81.2 80.4 3 A–W 16.2 67.7 29.8 83.0 67.8 44.3 65.3 64.1 4 B–S 17.2 88.1 4.7 61.7 69.0 65.2 94.5 92.4 5 B–N 15.2 82.2 11.2 75.1 68.4 58.6 85.7 85.1 6 B–W 19.2 72.7 23.6 82.6 68.5 49.6 72.4 71.4 7 C–S 17.3 85.6 8.8 71.2 68.4 59.0 86.3 87.6 8 C–N 16.1 58.5 38.8 85.3 67.9 37.0 54.7 54.5 9 C–W 14.3 40.9 56.5 83.6 67.8 22.1 32.6 32.4 10 A–N 1.3 21.2 75.2 91.3 68.6 10.6 15.5 17.6 11 A–N 2.6 29.3 66.3 90.6 67.9 16.7 24.6 26.8 11 A–N 3.5 42.5 53.0 87.7 67.9 25.0 36.8 39.6 12 A–N 4.3 40.0 54.3 86.0 67.3 24.3 36.1 36.9 13 A–N 5.0 45.3 48.6 85.4 66.5 27.4 41.2 43.1 14 A–N 6.0 64.9 29.6 82.8 67.5 42.7 63.3 64.3 15 A–N 7.5 67.1 28.7 83.4 67.4 43.3 64.2 65.6 16 A–N 9.0 72.4 22.4 82.3 68.4 48.0 70.2 72.8 17 A–N 10.2 60.0 36.4 84.9 67.4 38.2 56.8 57.1 18 A–N 11.8 70.2 26.7 82.5 67.8 45.8 67.6 67.6 t (min), reduction time (see step 2 in Fig. 2) Pa (%), apparent progress of reduction (see equation (2) and step 2 in Fig. 2) Ere (%) normalized residual stress after reoxidation (see step 5 in Fig. 2) Ero (%) normalized Young’s modulus after reoxidation (see step 7 in Fig. 2) ℓ (mm) extended length measured on recording paper (see step 6 in Fig. 2) Δℓ (mm), set length measured on recording paper, (see step 6 in Fig. 2) Sℓ, observed set [see equation (1)] So, calculated set using equation (5).
Purchased for the exclusive use of nofirst nolast (unknown)
From: SCC Media Library & Resource Center (library.scconline.org)