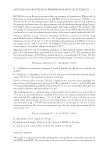
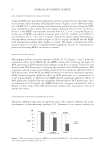
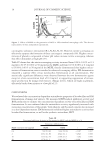
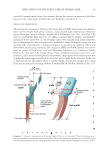
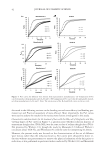
SIRTUIN EXPRESSION AS A FUNCTION OF TIME AND UVB IN EPIDERMAL KERATINOCYTES 59 RNA EXTRACTION AND QUANTIFICATION NHEK were plated in 100 mm plates at 5 × 10⁵ cells per dish. After treatments were completed, RNA was extracted from cells using a QIAshredder tube (Qiagen, Valencia, CA) in conjunction with the RNeasy mini kit (Qiagen) as per the manufacturer’s instruc- tions. RNA was then quantifi ed by measuring its absorbance at 260 nm with a DU7500 spectrophotometer (Beckman, Fullerton, CA). R EVERSE TRANSCRIPTION AND REAL-T IME POLYMERASE CHAIN REACTION RNA was reverse transcribed using a High Capacity cDNA Archive Kit from Applied Biosystems, Inc. (ABI, Foster City, CA), as per the manufacturer’s instructions. Real-time polymerase chain reaction (RT-PCR) was employed using the 2X TaqMan Fast Universal PCR Master Mix (ABI) in conjunction with a 20X TaqMan Gene Expression Assay Mix (ABI), which consists of human primers and probes for Sirt1 (ABI P/V Hs01009005_ m1), Sirt3 (ABI P/N Hs00202030_m1), Sirt4 (ABI P/N Hs01015516_g1), Sirt6 (ABI P/V Hs00966002_m1), and the endogenous control, glyceraldehyde-3-phosphate dehy- drogenase (G APDH, ABI P/N Hs99999905_m1). Primers and probes were designed to span exon–exon junctions to ensure amplifi cation of only the transcribed gene of interest and not any residual genomic DNA that might have been present. Relative gene expres- sion (change in expression of target gene normalized to an endogenous control (GAPDH) and relative to a reference group (untreated cells)) of real-time RT-PCR data was calcu- lated using the 2 −ΔΔCT method. ATP/H2O2 DETERMINATION NHEK were grown in 96-well black clear bottom plates at 3 × 10⁵ cells per plate. Cells were starved, released from starvation, and irradiated as described above. ATP was mea- sured with a luminescence-based assay, ATP Lite (Perkin Elmer, Waltham, MA), according to the manufacturer’s instructions. Luminescence was measured on an Lmax luminometer (Molecular Devices). H2O2 was measured with a method using CM-H2DCFDA (Invitrogen, Eugene, OR). Fifty micrograms of CM-H2DCFDA was dissolved in 100 μl ethanol and then a 1:100 working dilution of the CM-H2DCFDA/ethanol solu- tion was prepared in D-PBS. Cells were incubated with the working dilution at 37°C for 20 min. Then an equal amount of 25 mM NaN3 in D-PBS was added directly to the working dilution and incubated for another 2 h at 37°C. Fluorescence was measured at 485 nm/530 nm (excitation/emission) with a Spectra Max Gemini EM (Molecular Devices) (10). RESULTS NHEK were synchronized by serum supplement deprivation for 15 hours followed by repletion in full media to follow the cycle of sirtuins under normal conditions. Samples were then harvested at 0, 2, 4, 6, and 8 h and RNA extracted and analyzed by real-t ime RT-PCR. These results are illustrated in Figure 1a and show that sirt1, 3, and 6 follow the

JOURNAL OF COSMETIC SCIENCE 60 same kinetics for the fi rst 4 h unlike sirt4, which responds inversely. Interestingly, a sub- sequent rise in transcription was observed for sirt6 after 6 h that was not detected in either sirt1 or sirt3 and may refl ect an increased need for DNA base repair related to cell cycle kinetics and replication. When NHEK were then either exposed to 10 mJ/cm2 UVB or sham-irradiated under the same conditions, a different pattern of sirtuin expression emerged. As shown in Figure 1. (A) Real-time RT-PCR analysis of sirtuin expression in synchronized NHEK 0, 2, 4, 6, and 8 h after repletion in complete media. Values were normalized to GAPDH housekeeping genes and expressed as 1 at the zero time point using the calculation method: 2−ΔΔCT. Sirt1, 3, and 6 followed a similar temporal pattern of expression whereas sirt6 increased at the 6-h time point. (B) UVB (10 mJ/cm2) irradiation of NHEK, followed by repletion in complete media, disrupted sirtuin expression over time although sirt6 ap- peared to recover and increase at the 6-hour time point. Error bars were calculated for both graphs using S.E. measurement (n = 3).
Purchased for the exclusive use of nofirst nolast (unknown)
From: SCC Media Library & Resource Center (library.scconline.org)