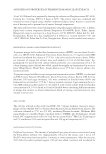
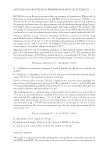
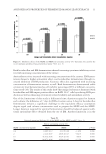
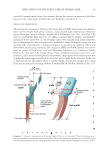
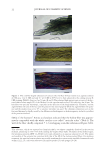
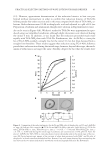
PRACTICAL SELECTING METHOD OF WAVE LOTION FOR HAIR DRESSER 41 The holding strengths (S, N, and W) of the lotions from each manufacturer agreed well with the order of the corresponding Pa values obtained at 15 min. If the user applies wave lotions produced only by one manufacturer, the Pa/t curves may not be signifi cant, be- cause the order of the holding strengths (S, N, and W) agreed with the Pa values obtained at 15 min, and they are not necessary for selecting a particular wave lotion. However, without the Pa/t, the characteristic behavior of B–N, would not be detected, i.e., intersec- tion of B–N and B–S [see Manufacturer B in Figure 5(A)]. In addition, comparison of the behavior of wave lotions of the same strength (S, N, or W) from different manufacturers is not possible when only on the basis of the indication of S, N, or W on the package. In these cases, Pa/t curves provide helpful information, as can be seen in Figure 5(B). The differences in the curves were found to be signifi cant (p value 0.05) as determined using a two-way layout analysis of the variance for six repeated test results for each lotion. Therefore, for practical purposes, an indication of the strength of the wave lotion (S, N, or W) as a numeric expression, such as the Pa value at 5 min taken from the Pa/t curve (see Practical assessment of wave effi cacy for an explanation of the use of 5 min) is desired. However, in order to provide Pa values at 5 min that can be compared, a standard appa- ratus and method for determining the Pa/t curves of permanent waving lotions is needed. Note that the intersection of the B–S and B–N curves shown in Figure 5(A) can only be detected by plotting the Pa/t curves. In this case, the Pa values for the B–N lotion were greater than those of the B–S lotion at a short reduction time (5 min) and less than those of the B–S lotion at a long reduction time (15 min). This reversal of the reduction behavior is Figure 4. Relationship between the observed set (Sℓ) and the calculated set (So) obtained using equation (5). The letter for each plot indicates the sample name (see Table I) (■), (▲), and (●) indicate the applied reduc- tion times shown in Exp. Nos.1–9 in Table II. A–N applied for the various reduction times are listed in Exp. Nos. 10-18 in Table II. Correlation: y = 1.00X, r = 0.997. Note: Linear viscoelasticity about set in exten- sional permanent treatment.

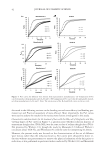
JOURNAL OF COSMETIC SCIENCE 42 discussed in the following sections on the bending set and wave effi cacy (see Bending per- manent set and Practical assessment of wave effi cacy). Most importantly, the Pa/t curves were used to analyze the results for the various wave lotions investigated in this study. Characteristic reduction kinetics for the treatment of hair with the NH4 salt of thioglycolic acid. Re- viewing shapes of Pa/t curves in Figure 5, a question arose whether reduction kinetics of ammonium thioglycolate (TGA-NH4) was the same as that of sodium thioglycolate (TGA- Na) presented by Wickett (11), though the study by Manuszak (12) followed Wickett’s conclusion about TGA-Na, and Wortmann (4) cited the same for interpreting his theory. However, the present study was focused on the characterization of the set of different wave lotions rather than the reduction kinetics, Pa/t curves were obtained for direct re- duction without any pretreatment to remove the physical relaxation of the hair prior to reduction, as was performed in previous studies conducted by Wickett (11) and Manuszak Figure 5. Pa/t curves for different wave lotions from representative manufacturers. (A) Comparison of Pa/t curves for products from manufacturers A, B, and C. (B) Comparison of Pa/t curves for the same grades of prod- ucts from manufacturers A, B, and C. Note: The intersection of the B–S and B–N curves in (A) (see text).
Purchased for the exclusive use of nofirst nolast (unknown)
From: SCC Media Library & Resource Center (library.scconline.org)