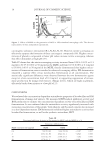
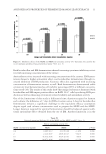
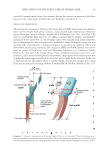
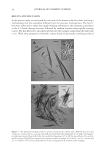
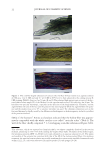
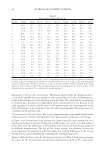
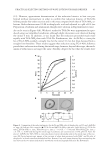
PRACTICAL SELECTING METHOD OF WAVE LOTION FOR HAIR DRESSER 45 because the slope of the line changed dramatically for reduction times greater than 20 min. These results therefore confi rmed that reductions with the NH4+ salts listed in Table I follow pseudo fi rst-order kinetics only during the initial stage of the reaction, and beyond this stage, the reductions proceeded by a different mechanism. DIFFUSION RATE OF TGA-NA AND TGA-NH4 Two main factors may contribute to the differences in the reduction kinetics for the Na+ and NH4+ salts: the dissociation constants K2 = [H+][−S-CH2-C00−]∕[HS-CH2-C00−] for TGA-Na and TGA-NH4 and the difference in their diffusion rates into hair fi bers. The K2 values for TGA-Na and TGA-NH4 have been determined using titration and spectro- metric methods (13,14) however, no difference was detected. With respect to their dif- fusion rates into hair, Garcia et al. (15) found that using the differential extension method, TGA-NH4 rapidly diffuses into hair by the differential extension method. In the present study, the rates of diffusion of TGA-Na and TGA-NH4 were compared using the method described in part 5 of the Experimental section. Figure 6(B) shows the microphotographs of the obtained dyed cross sections along with plots of the gray values of the digital images (bottom). It can be concluded from the fi g- ure that the diffusion of TGA-NH4 was much faster than that of TGA-Na. Therefore, because both reductions followed a pseudo fi rst-order reaction for the initial 5 min, the large difference in the performance of the NH4 and Na salts can be attributed to their different diffusion rates. The diffusion patterns of TGA-NH4 and cysteine into hair were studied by Kuzuhara and Hori using a combination of microspectrophotometry and dyeing techniques (16). These researchers found that the different patterns for diffusion result from the electrostatic interaction of the free amino groups of cysteine with the anionic ions of human hair. However, it was not possible in the present study to explain the mechanisms underlying the different diffusion rates for TGA-NH4 and TGA-Na. On the basis of the available information, it is thought that the interactions between the NH4+ and Na+ groups associated with thioglycolic acid and the anions on the surface of human hair may be quite different. Further study is needed to elucidate the actual cause of the different diffusion rates. It was demonstrated, however, that the reduction kinetics for TGA-NH4 was different from that of TGA-Na, and thus the conclusions on the kinetics of TGA-Na drawn by Wickett cannot be generally expanded to the ammonium salt of thioglycolic acid. BENDING PERMANENT SET The subject of this experiment was the correlation between the bending and extensional sets. The same single fi ber was divided into two pieces, 10 cm and 15 cm in length. The shorter fi ber was used for the bending test and placed in the apparatus shown in Figure 3. The longer fi ber was used for the extensional test as described above. The waving lotions A–S, A–N, B–S, B–N, and C–W were selected as the representative wave lotions for this investigation, and each was applied for various reduction times. The results are presented in Table III and Figure 8(A), which show the relationship between the experimentally determined set values for the bending and extensional treatments. The bending sets correlated well with the

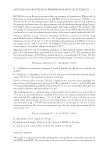
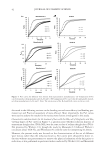
JOURNAL OF COSMETIC SCIENCE 46 extensional sets (y = 0.787x + 18.20, r =0.974). Notably, after 5 min of reduction, the bend- ing set value for the B–N lotion was greater than that of the B–S lotion, while it was less than that of the B–S lotion after 16 min of reduction. This reversal is similar to the results obtained for the Pa/t curves for B–S and B–N lotions, as shown in Figure 5(A), and suggests that the mechanism of deformation is the same for both bending and extensional treatments. Furthermore, these results demonstrate that the bending set behavior can be accurately predicted by the extensional set behavior, which is in disagreement with Wortmann’s claim regarding the weak correlation between the extensional and bending sets. Larger bending sets than extensional sets. One problem associated with the results given in Figure 8(A) is that the bending sets are larger than those obtained after extensional treatment, because the straight line shown in the fi gure does not pass through the origin. The issue of larger bending sets compared to the corresponding extensional sets has been discussed by Wortmann (10) and Feughelman Table III Bending and Extensional Setting Tests Using the Same Hair Exp. No Wave lotion Time (min)a Pa(%) Sℓ(ext)(%)b Sℓ(bend)(%)c 1 A–S 9.5 80.3 84.3 7.9.0 2 A–S 11.1 80.8 86.3 84.3 3 A–S 15.0 84.8 89.4 82.6 4 A–N 10.0 52.9 49.5 58.8 5 A–N 9.2 48.4 51.9 51.8 6 A–N 15.4 67.5 65.1 66.1 7 A–N 15.1 64.3 67.1 71.5 8 A–N 15 62.3 60.4 61.0 9 B–S 16 56.3 87.4 80.0 10 B–N 16.3 69.1 78.3 73.0 11 B–S 5.0 87.4 56.3 56.8 12 B–N 5.0 78.3 69.1 68.0 13 C–S 3.4 20.4 21.1 34.5 14 C–S 4.7 27.6 27.6 41.3 15 C–S 10.0 36.4 35.4 46.7 16 C–S 10.6 43.4 42.2 52.7 17 C–S 9.3 68 70 70.0 18 C–S 14.2 72.5 74.6 83.3 19 C–S 11.9 72.9 76.8 77.5 20 C–S 10.1 40 39.6 47.3 21 C–S 5.0 26.7 24.7 37.9 22 C–S 15 51.8 53.8 53.0 23 C–S 9.1 63.2 64.1 65.8 aReduction time. bExtensional set [equation (1)]. cBending set [equation (3)].
Purchased for the exclusive use of nofirst nolast (unknown)
From: SCC Media Library & Resource Center (library.scconline.org)