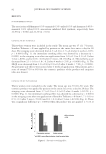
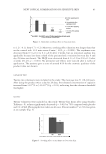
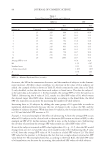
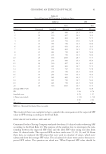
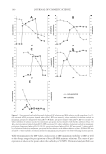
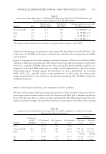
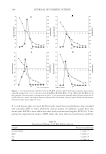
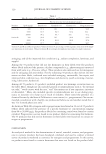
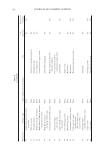
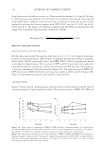
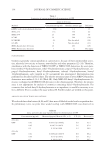
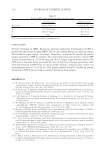
CHOOSING AN EXPECTED SPF VALUE 91 Table II Typical Data from SPF Testing on 10 Subjects Twice MED (s) SPF Test Test Subject no. Untreated Standard Material Standard Material 1 15 245 990 16.3 66.0 2 19 310 827 16.3 43.5 3 15 281 863 18.7 57.5 4 15 225 792 15.0 52.8 5 15 245 750 16.3 50.0 6 15 245 653 16.3 43.5 7 15 245 863 16.3 57.5 8 15 281 750 18.7 50.0 9 15 245 750 16.3 50.0 10 19 356 1093 18.7 57.5 11 15 245 990 16.3 66.0 12 19 310 827 16.3 43.5 13 15 281 863 18.7 57.5 14 15 225 792 15.0 52.8 15 15 245 750 16.3 50.0 16 15 245 653 16.3 43.5 17 15 245 863 16.3 57.5 18 15 281 750 18.7 50.0 19 15 245 750 16.3 50.0 20 19 356 1093 18.7 57.5 Average SPF (n=20) 16.9 52.8 SD 1.28 6.78 Standard error 0.29 1.52 t-Value (one-tailed) 1.729 1.729 A 0.50 2.62 SPF value 16 50 MED (s) - Minimal Erythemal Dose (seconds). The results of these two examples led us to consider the consequences of the expected SPF value in SPF testing according to the Final Rule. EXPECTED SPF VALUE AFFECTS THE LABEL SPF Consumer Product Testing Company analyzed data from 10 clinical trials evaluating SPF according to the Final Rule (6). The purpose of the analysis was to investigate the rela- tionship between the expected SPF value and the label SPF value using real data from these 10 clinical trials. The expected SPF on these trials were 15, 20, 30, and 50. From these data, we analyzed the SD values that were used to calculate A values, which were subtracted from the average SPF value. The calculated A values were used to forecast ex- pected SPF values. The question we asked was “What Expected SPF value should be

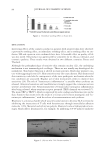
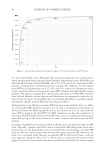
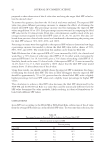
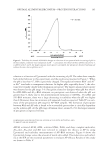
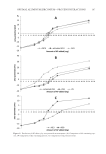
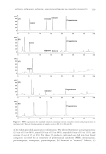
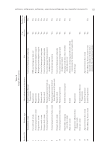
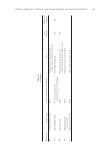
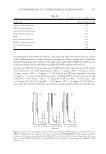
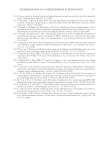
JOURNAL OF COSMETIC SCIENCE 92 proposed so that subtraction of the A value does not bring the target label SPF value be- low the desired value?” To answer this question, data from the 10 clinical trials were analyzed. The expected SPF value was given different percentage increases to examine the effects of obtaining the desired label SPF value. The percentage increase used for examining the expected SPF values ranged from 5% to 15%. Each percentage increase was used in comparing the label SPF value for the 10 clinical trials. From this, a determination could be made of the per- centage increase required for the label SPF values of 15, 20, 30, and 50. The data col- lected from previous clinical trials served as a benchmark in determining the passing rate for label SPF values at 70%, 80%, 90%, and 100%. Percentage increases were then applied to the expected SPF values to determine how large a percentage increase was needed to obtain the label SPF value with a chance of 70%, 80%, 90%, and 100%. The results from this analysis can be found in Table III. Table III shows that if the expected SPF of 15 were increased by 8.8%, the clinical trial would have a 70% chance of achieving a label SPF of 15. In other words, increasing the expected SPF from 15 to 16.3 (or 8.8%) gives a 70% chance of reaching a label SPF of 15. Similarly, based on the same 10 clinical trials, if the expected SPF of 15 were increased by 14.4%, from 15 to 17.2, there would be a 100% chance that the label SPF value would remain above 15 after subtraction of the A value. Using these results, one should carefully choose the expected SPF to maximize the chance of obtaining the desired label SPF. The data in Table III suggest that the expected SPF should be approximately 7% to 9% greater than the desired label SPF, with a slightly higher percentage for lower SPF values and a slightly lower percentage for higher SPF values. This calculation to achieve a label SPF value decreases the label SPF determined by the FDA-FM and the FDA Final Rule to a value that could be statistically different from the SPF value determined by other methods, likely resulting in identical formulations la- beled with different SPF values. CONCLUSIONS In an SPF test according to the FDA-FM or FDA Final Rule, subtraction of the A value from the average SPF results in a reduced label SPF value. To overcome this reduction, the Table III Percentage Increase in Expected SPF to Achieve the Desired Label SPF Percent increase in expected SPF Percent passing Label SPF 70 80 90 100 15 8.8 9.6 10.2 14.4 20 6.7 7.9 8.5 11.4 30 6.1 8.4 8.7 10.6 50 5.9 7.4 8.1 8.7
Purchased for the exclusive use of nofirst nolast (unknown)
From: SCC Media Library & Resource Center (library.scconline.org)